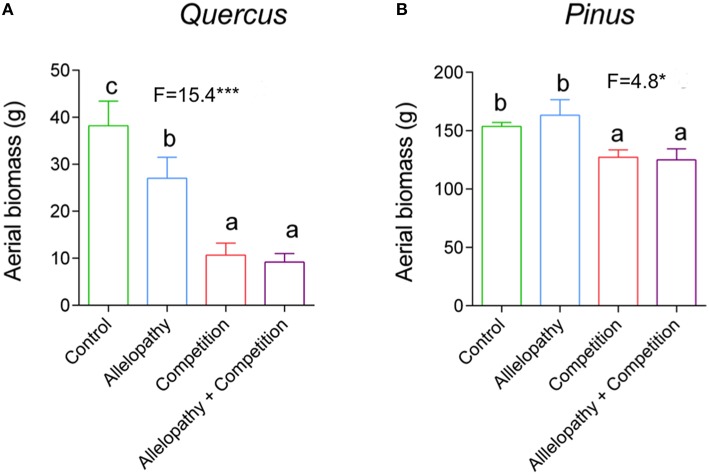
Figure 3.
Effects of interference treatment on aerial biomass of Pinus and Quercus. Height growth response in Quercus (A) and Pinus (B) in Control (green bars), Allelopathy (blue bars), Competition (red bars), and Allelopathy + Competition (purple bars) treatments. Bars are means ± SD (5 ≤ N ≤ 12). Different letters indicate a significant difference between treatments.

