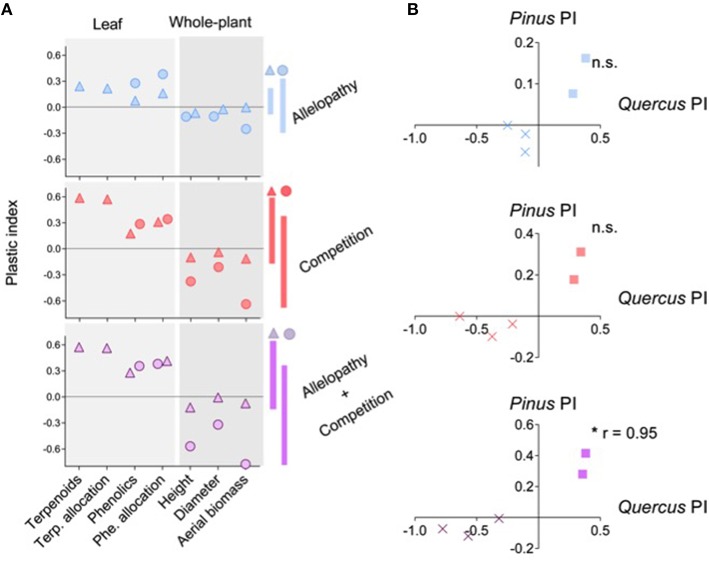
Figure 6.
Overall Phenotypic Responses (OPR) of Pinus and Quercus to the three interference treatments. Global representation (A) of plastic index (PI) of 7 selected traits in response to Allelopathy (blue symbols), Competition (red symbols) and Allelopathy + Competition (purple symbols) treatments for Pinus (triangles) and Quercus (circle). Positive or negative value of PI for a trait indicates positive or negative phenotypic response, respectively, for this trait to corresponding interference treatment. Vertical bars indicate the magnitude of the OPR in both species to each interference treatment. Pearson correlation (B) between the OPR (cross for growth traits and square for biochemical traits) of both species to Allelopathy (blue symbols), Competition (red symbols) and Allelopathy + Competition (purple symbols) treatments. Asterisks indicate a significant value at P < 0.05 (*).

