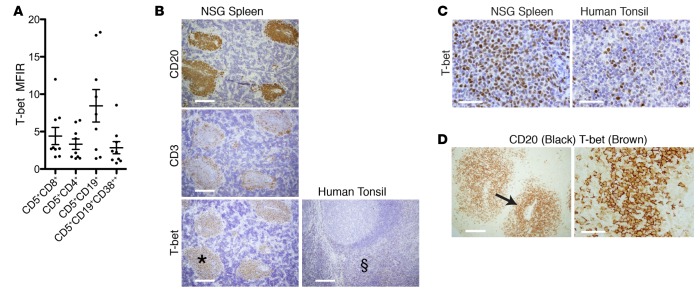
Figure 8. Both B and T cells within CD20+PAX5+ perivascular aggregates (PVAs) express T-bet protein.
(A) T-bet is expressed by spleen-residing chronic lymphocytic leukemia (CLL) T cell and B cell populations at euthanasia. Data from 9 independent experiments with 9 CLL clones. Mean and SEM shown. (B and C) T-bet expression localizes to CD20+PAX5+PVAs and is of similar intensity to that in tonsillar T cell areas. (B) Human (h) CD20+, hCD3+, and hT-bet+ cells from NSG spleen. T-bet is also shown in tonsil. Scale bar: 250 μm. (C) High-power images of T-bet+ cells in a CD20+PAX5+PVA (area marked with * in B) and in the T cell area of tonsil (area marked with § in B). Scale bar: 250 μm. Spleen data representative of 13 independent experiments (n = 33 mice). (D) Dual IH shows that CD20+ and CD20– cells within CD20+PAX5+PVAs are T-bet+. Left panel: CD20 (black) and T-bet (brown) protein in CD20+PAX5+PVA. Scale bar: 250 μm. Right panel: High-power view of area marked by arrow. Scale bar: 50 μm. NSG, NOD/Shi-scid,γcnull; PVA, perivascular aggregate; IH, immunohistology; MFIR, mean fluorescence intensity ratio.

