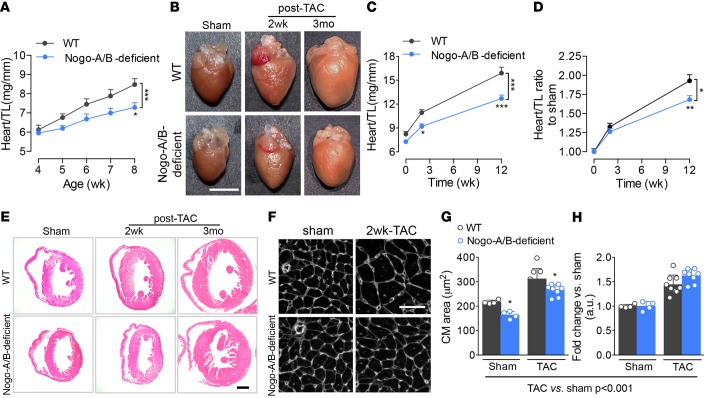
Figure 2. Nogo-A/B–deficient mice were protected from pathological hypertrophy induced by chronic pressure overload.
(A) Heart weight/tibia length ratios (heart/TL) of WT and Nogo-A/B–deficient mice at 4, 5, 6, 7, and 8 weeks of age. n ≥ 6/group. (B) Representative images of WT and Nogo-A/B–deficient hearts of sham- and transverse aortic constriction–operated (TAC-operated) mice at indicated time points. Scale bar: 5 mm. (C) Analysis of heart/TL ratios for TAC- and sham-operated WT and Nogo-A/B–deficient mice at indicated time points. n ≥ 8/group. (D) Heart/TL ratios for sham- and TAC-operated WT and Nogo-A/B–deficient mice expressed as fold increase over the respective sham-operated groups. n ≥ 8/group. (E) Hematoxylin and eosin staining of cross sections of hearts of TAC- or sham-operated WT and Nogo-A/B–deficient mice at indicated time points. Scale bar: 1 mm. (F) Immunofluorescence staining with WGA of cardiac cross sections from sham-operated WT and Nogo-A/B–deficient mice or mice 2 weeks after TAC. Scale bar: 50 μm. (G) Absolute and (H) relative-to-sham quantification of cardiomyocyte cross-sectional area in sham-operated WT and Nogo-A/B–deficient hearts and hearts 2 weeks after TAC. n = 4 sham-operated and n=8 banded-heart. Data are expressed as mean ± SEM. *P < 0.05, **P < 0.01, ***P < 0.001 compared with WT at the indicated time points or treatments. Statistical significance was determined by (G) 1-way ANOVA followed by Tukey’s multiple comparison test or (A, C, and D) 2-way ANOVA followed by Tukey’s multiple comparison test.

