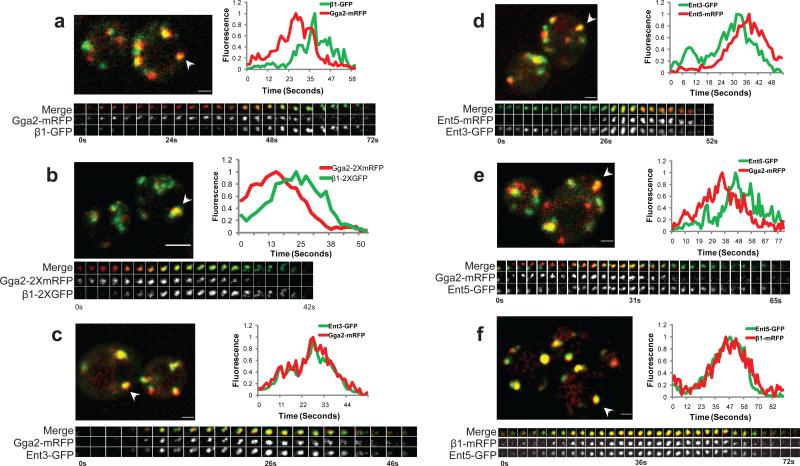
Figure 1. Sequential assembly of clathrin adaptors.
Pairs of clathrin coat proteins were assessed in two-color movies of single optical sections (a, c-f) or in 3 dimensions (b) by tracking puncta that remained separate from other puncta throughout their lifetimes and were present for at least 7 frames (~8.4 s). (a, c-f) Upper panel: merged image of live cells co-expressing GFP- and mRFP-tagged versions of the indicated clathrin adaptors; arrowhead indicates a puncta selected for kymograph in the bottom panel. Scale bar = 1 μm. (b) Upper panel: Five optical sections along the Z axis were imaged at 0.3 μm intervals. Each z-stack was collected every 2.1s. Scale bar = 2μm. (a-f) Bottom panel: three channel kymograph (merged, mRFP and GFP) of the selected puncta; time to acquire one image pair was 1.2s. Every other image pair is shown in the kymograph. (a-f) Graph: normalized level of GFP and mRFP fluorescence intensity in the puncta as a function of time. (a) GPY3109 (b) GPY4974 (c) GPY3954 (d) GPY3912 (e) GPY3962 (f) GPY3900.

