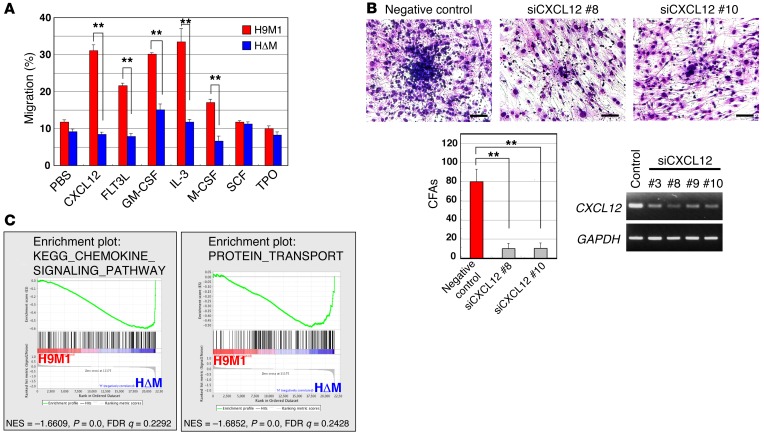
Figure 2. Association of the cell migratory activity with MEIS1.
(A) Cell migration assay. CXCL12, FLT3L, GM-CSF, IL-3, and M-CSF significantly enhanced cell migration of H9M1 but not HΔM cells. Results represent mean frequencies of migratory cells per 5 × 10⁵ cells ± SEM of 3 independent experiments (**P < 0.01, 2-tailed Student’s t test). (B) Inhibition of interaction between H9M1 and OP9 cells by CXCL12 knockdown in OP9 cells. A significant decrease of cobblestone areas was observed in OP9 cells treated with two independent CXCL12-targeting siRNAs. Scale bar: 100 μm. Numbers of cobblestone areas are indicated as the mean ± SEM of 3 independent experiments (**P < 0.01, 1-way ANOVA with Dunnett’s multiple comparison test). (C) Global gene expression changes of H9M1 cells in response to Meis1 KO. The data sets of gene expression differences resulting from Meis1 KO were used for GSEA. Enrichment plots are shown for selected sets identified by GSEA. Normalized enrichment scores (NES), nominal P values (calculated by an empirical phenotype-based permutation test), and FDR q values are indicated.

