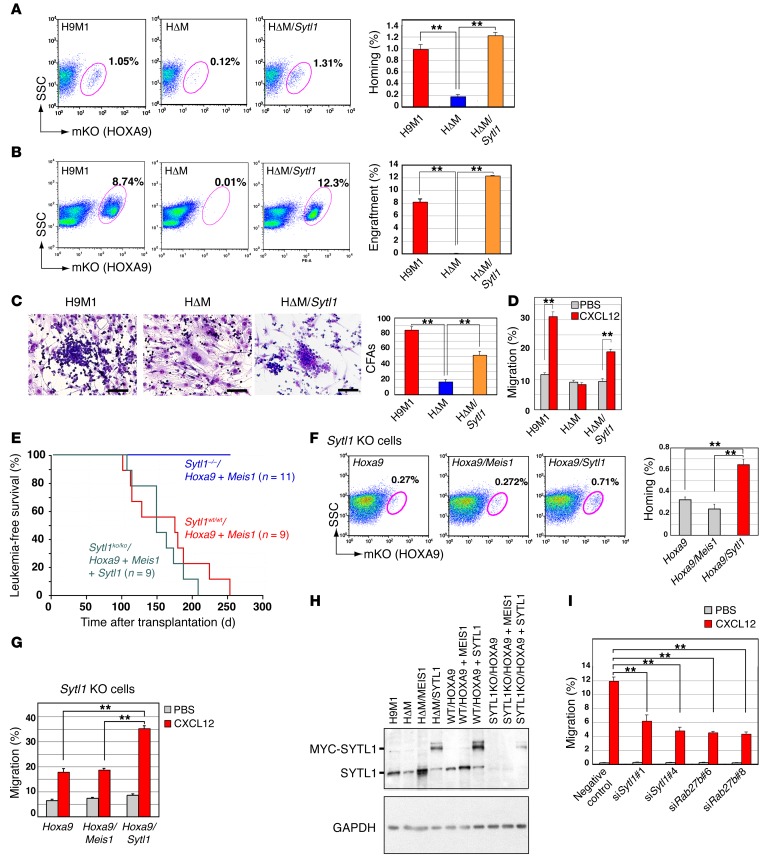
Figure 4. SYTL1 supports leukemic cell engraftment.
(A) Sytl1 was retrovirally introduced into HΔM cells. Forty-eight hours after transplantation, bone marrow samples were analyzed for mKO-positive fractions by flow cytometry. Data are representative of 3 experiments. (B) Representative flow cytometric analysis (same as A) was performed 2 weeks after transplantation (3 experiments). (A and B) Frequencies of mKO-positive cells in bone marrow are indicated. (C) Representative images of OP9 coculture experiments (3 experiments). Cobblestone areas were recovered after SYTL1 was introduced into HΔM cells. The numbers of cobblestone areas are indicated. Scale bar: 100 μm. (D) Cell migration assay. H9M1, HΔM, and HΔM/SYTL1 cells were loaded onto chamber inserts. Cells migrated to the lower chamber containing CXCL12. Mean values of migratory cells per 5 × 10⁵ cells ± SEM. (E) Sytl1 deletion abrogated HOXA9/MEIS1-induced leukemogenesis. Kaplan-Meier survival curves are shown for recipients transplanted with Hoxa9/Meis1-transduced bone marrow cells on a wild-type or Sytl1–/– background and Sytl1/Hoxa9/Meis1-transduced bone marrow cells on a Sytl1–/– background. (F) Homing of Hoxa9-transformed bone marrow cells of Sytl1–/– background was enhanced by Sytl1 but not by Meis1. Frequencies of mKO-positive cells in bone marrow were measured 48 hours after transplantation. (G) Migration upon CXCL12 stimulation of Hoxa9-transformed bone marrow cells of Sytl1–/– background was enhanced by Sytl1 but not by Meis1. All the experiments were performed in triplicate. (H) The expression levels of both endogenous and exogenous SYTL1 proteins were assessed by immunoblotting; blots are representative of 2 independent experiments. (I) Knockdown of Sytl1 or Rab27b inhibited cellular migration of 32Dcl3 cells after CXCL12 stimulation. (A–D, F, and G–I) n = 3, **P < 0.01, 1-way ANOVA with Dunnett’s multiple comparison test. Mean ± SEM is shown throughout.

