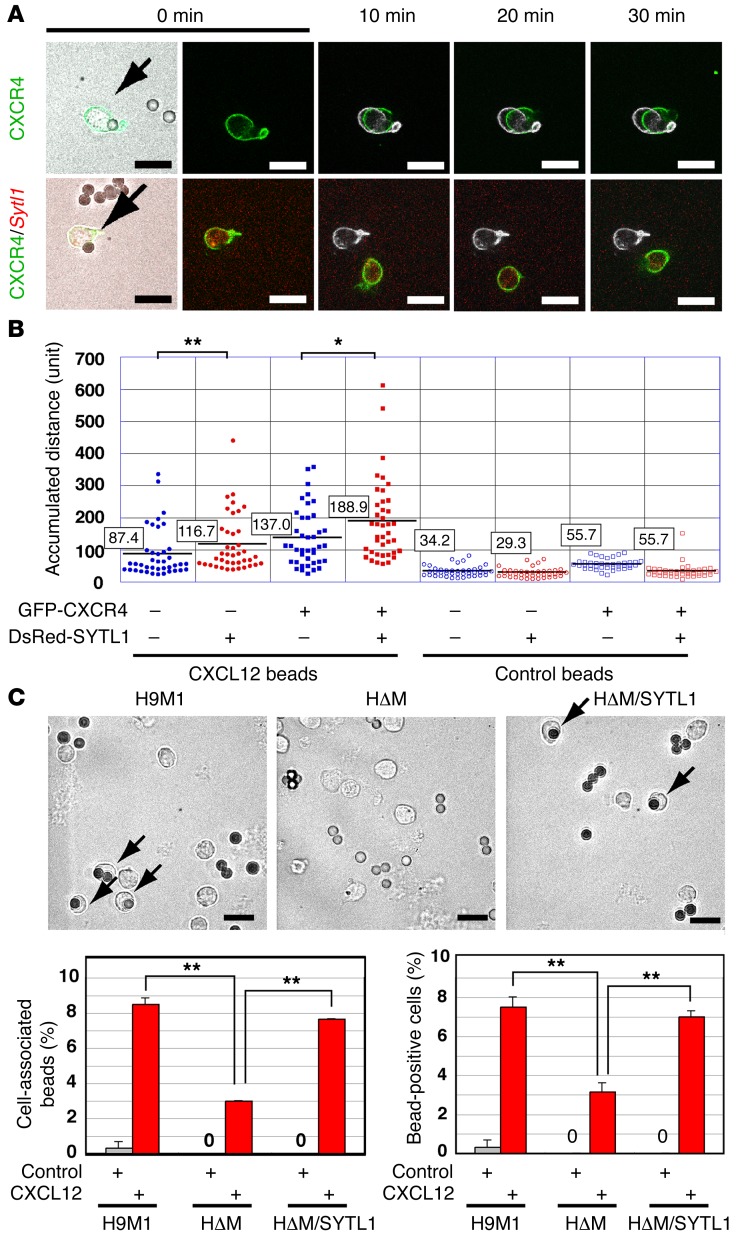
Figure 6. Sytl1 increases CXCL12/CXCR4 signaling.
(A) Motility of 32Dcl3 cells with or without Sytl1 overexpression was observed during a 30-minute period of stimulation by CXCL12-coated beads. The original position of each cell is indicated as a white mark at 10, 20, or 30 minutes. See Supplemental Videos 1 and 2 for videos of the same cells. Representative images of 3 independent experiments are shown. Scale bar: 20 μm. (B) CXCL12-induced chemotaxis was quantified by measuring the accumulated distance in 40 cells each for SYTL1-expressing and -nonexpressing 32Dcl3 cells. Average accumulated distances (in number of 280-nm units) are indicated in boxes (n = 3, *P < 0.05; **P < 0.01, Mann-Whitney test). (C) Frequent incorporation of CXCL12-coated beads in H9M1 and HΔM/SYTL1 cells. Cells were seeded into VCAM1-coated chambers. The cells were fixed with 4% paraformaldehyde 5 minutes after addition of CXCL12-coated beads. Representative images of 3 independent experiments (arrows) are shown. The number of cells incorporating CXCL12-coated beads was measured. Frequencies of positive cells are indicated as the mean ± SEM of 3 independent experiments (**P < 0.01, 2-tailed Student’s t test). Scale bar: 20 μm.

