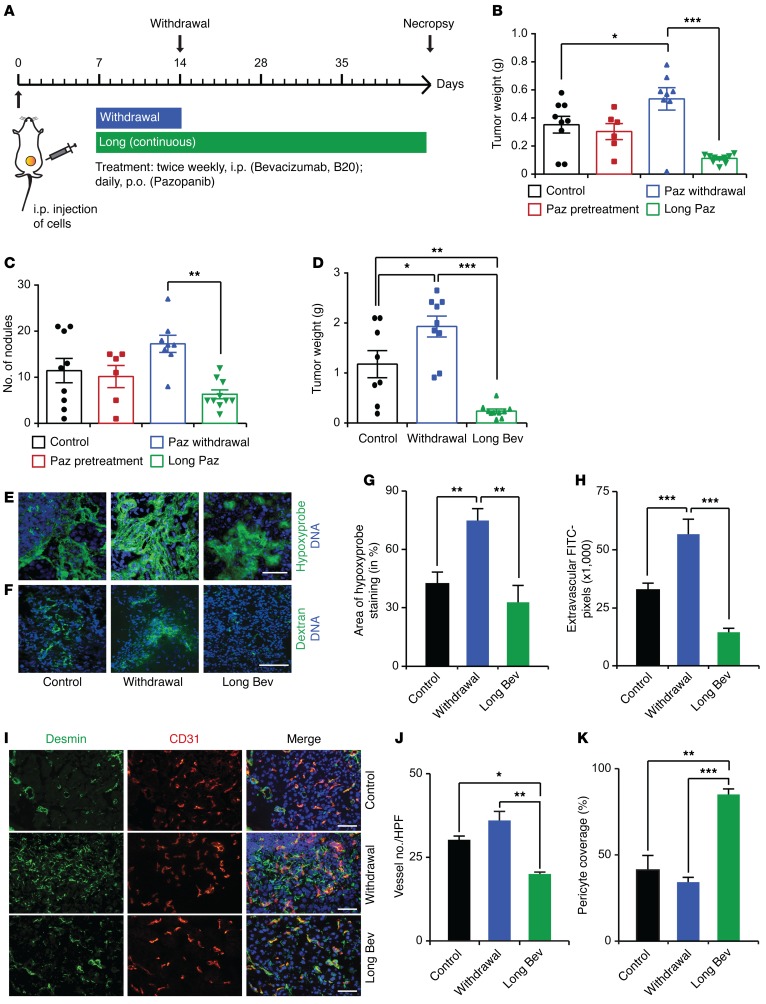
Figure 1. Tumor rebound after cessation of antiangiogenic therapy.
(A) Therapeutic schema for withdrawal and continuous treatment with antiangiogenic therapy. (B) Mean aggregate tumor weight and (C) number of nodules of tumors induced by i.p. injection of SKOV3ip1 human ovarian cancer cells into nude mice with various antiangiogenic treatment schedules. (D) Mean aggregate tumor weight of 2774 ovarian tumors after bevacizumab withdrawal or continuous treatment. (E) Visualization of tumor hypoxia and (F) vascular permeability after i.v. injection of hypoxyprobe and dextran, respectively. Scale bar: 100 μm. (G and H) The quantification of hypoxyprobe staining and the number of FITC+ dextran pixels after indicated treatments. (I–K) Vessel number and pericyte coverage after antiangiogenic therapy withdrawal and continuous treatment. (I) Representative immunofluorescence staining and (J and K) bar graphs. HPF, high-powered field. Scale bar: 100 μm. (B–D) n = 8–10 mice per group. (E, F, and I) Representative images from at least 5 mice per group. *P < 0.05, **P < 0.01, ***P < 0.001 (1-way ANOVA followed by a Tukey’s multiple comparison post-hoc test in B–D, G, H, J, and K). Averaged data are presented as the mean ± SEM. Paz, pazopanib; Bev, bevacizumab.

