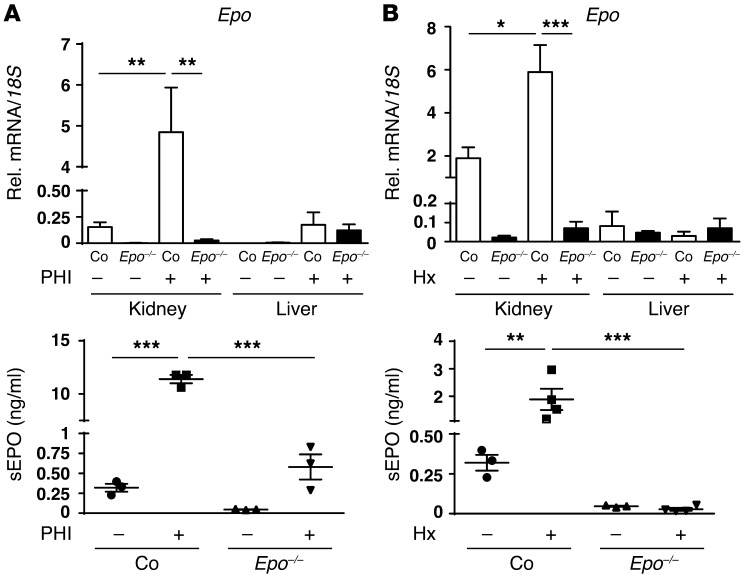
Figure 2. Renal EPO-producing cells are derived from FOXD1 stromal progenitors.
Shown are the relative renal and liver Epo responses to treatment with an orally administered HIF-PHD inhibitor (PHI) or normobaric hypoxia in control (Co) and Foxd1-Epo–/– mutants (Epo–/–). (A) PHI treatment with compound GSK1002083A (n = 3 each). (B) Treatment with 2 days of normobaric hypoxia (Hx) at 10% O2 (n = 3 and 4, respectively). The induction of Epo mRNA is completely suppressed (top panels), and serum EPO responses (bottom panels) are blunted in Foxd1-Epo–/– mutants. Data are represented as mean ± SEM; 2-way ANOVA with post hoc Tukey’s test; *P < 0.05, **P < 0.01, ***P < 0.001.

