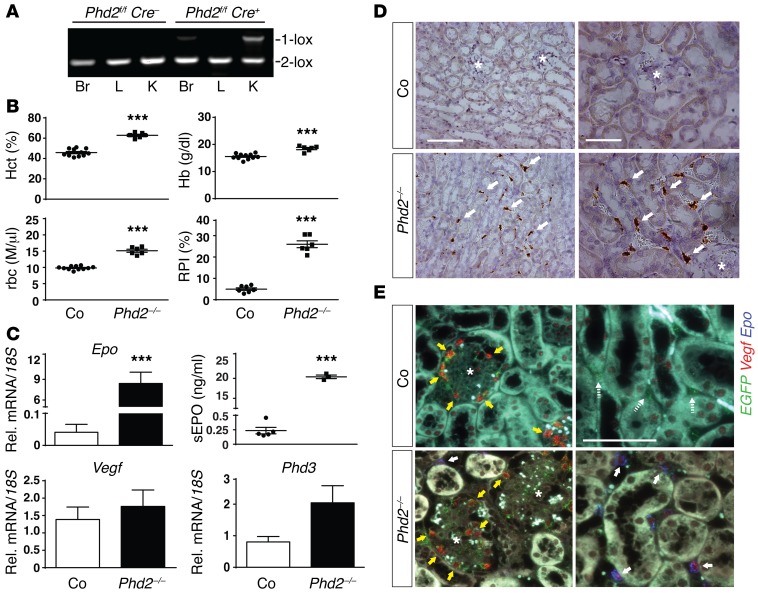
Figure 3. Inactivation of Phd2 in FOXD1 stroma-derived renal interstitial cells results in polycythemia.
(A) PCR analysis of genomic brain (Br), liver (L), and kidney (K) DNA isolated from control (Phd2fl/fl Cre–) and Foxd1-Phd2–/– (Phd2fl/fl Cre+) mutant mice. 2-lox denotes the nonrecombined conditional allele and 1-lox the recombined allele. (B) Individual values for hematocrit (Hct), hemoglobin (Hb), rbc counts, and reticulocyte production index (RPI) for control (Co) and Foxd1-Phd2–/– (Phd2–/–) mutant mice (n = 6–11). Data are represented as mean ± SEM; 2-tailed Student’s t test; ***P < 0.001. (C) Renal Epo, Vegf, and Phd3 mRNA and serum EPO (sEPO) level from control and Foxd1-Phd2–/– mutant mice (n = 3–6). Graph bars represent mean ± SEM; 2-tailed Student’s t test; ***P < 0.001 compared with control group. (D) Epo ISH in formalin-fixed, paraffin-embedded kidney sections from control and Foxd1-Phd2–/– kidneys using an HRP-based colorimetric detection method. White arrows indicate positively stained cells and asterisks depict glomeruli. Scale bars: 100 μm (left panels), 50 μm (right panels). (E) Vegf expression is increased in Phd2–/– interstitial cells. Shown are representative images of multiplex ISH studies using formalin-fixed, paraffin-embedded kidney tissue sections from Foxd1-mT/mG (Co) and Foxd1-mT/mG-Phd2–/– (Phd2–/–) mice. Epo+Vegf+ cells are denoted by white arrows; yellow arrows depict Vegf-expressing glomerular cells; glomeruli are marked with asterisks. Scale bar: 50 μm (all panels).

