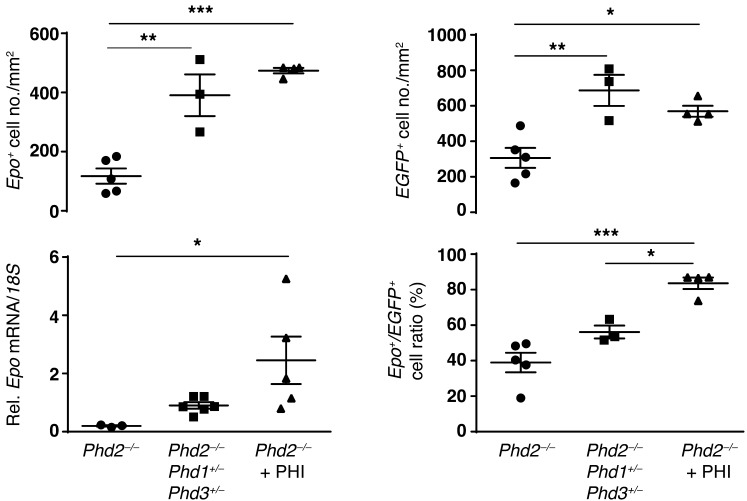
Figure 6. Inactivation of Phd1 and Phd3 increases renal EPO production in Phd2–/– kidneys.
Shown are the results from multiplex fluorescent ISH studies using formalin-fixed, paraffin-embedded kidney tissue sections from Foxd1-mT/mG-Phd2–/– (Phd2–/–) mutants (n = 5), Foxd1-mT/mG-Phd1+/–-Phd2–/–-Phd3+/– (Phd2–/–Phd1+/–Phd3+/–) mutants (n = 3) and Foxd1-mT/mG-Phd2–/– mice treated with GSK1002083A (Phd2–/– + PHI; n = 4). Top left panel: Quantification of Epo-expressing cells. Shown is the absolute number of Epo+ cells per square millimeter. Bottom left panel: Epo mRNA levels relative to 18S in total kidney tissue homogenates as determined by real-time PCR (n = 3–6). Top right panel: Quantification of EGFP-expressing cells. Shown is the absolute number of EGFP+ cells per square millimeter of kidney tissue. Bottom right panel: Fraction of Epo-expressing cells within the EGFP+ cell population. Data are represented as mean ± SEM; 1-way ANOVA with post hoc Tukey’s test; *P < 0.05, **P < 0.01, ***P < 0.001.

