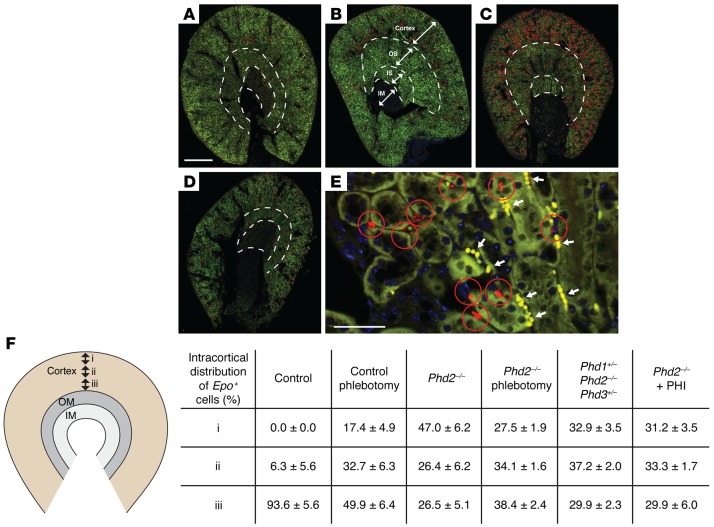
Figure 7. REPC topography in anemic mice differs from that in Foxd1-Phd2–/– mice.
Shown are representative annotated images illustrating the distribution of REPCs in anemic control and in Foxd1-Phd2–/– mice. Epo ISH studies were performed using formalin-fixed, paraffin-embedded kidney tissue sections. (A–D) Epo transcripts were detected by red signals in original images. To facilitate visualization and to provide an overview of Epo transcript distribution at low magnification, Epo+ cells were annotated with red circles. (A) Kidney section from control mouse at baseline. (B) Kidney section from control mouse with Hct of 26%. (C) Kidney section from control mouse with Hct of 15%. (D) Representative low-magnification image of kidney from a Foxd1-Phd2–/– mutant. (E) Representative high-magnification image of Epo ISH from control mouse with Hct of 15% to illustrate how Epo+ cells were annotated. rbc are denoted by white arrows. White dashed lines indicate borders between cortex, outer stripe (OS) and inner stripe (IS) of outer medulla, and inner medulla (IM). Scale bars: 1 mm (A–D), 50 μm (E). (F) Shown is the relative distribution of Epo-expressing cells in the outer (i), mid– (ii), and inner (iii) renal cortex from control mice at baseline (n = 4) and after phlebotomy (n = 5), Foxd1-mT/mG-Phd2–/– (Phd2–/–) mutants at baseline (n = 5) and after phlebotomy (n = 5), Foxd1-mT/mG-Phd1+/–-Phd2–/–-Phd3+/– (Phd1+/– Phd2–/– Phd3+/–) mutants (n = 3), and Foxd1-mT/mG-Phd2–/– mice treated with GSK1002083A (Phd2–/– + PHI; n = 4). Data are represented as mean ± SEM. OM, outer medulla.

