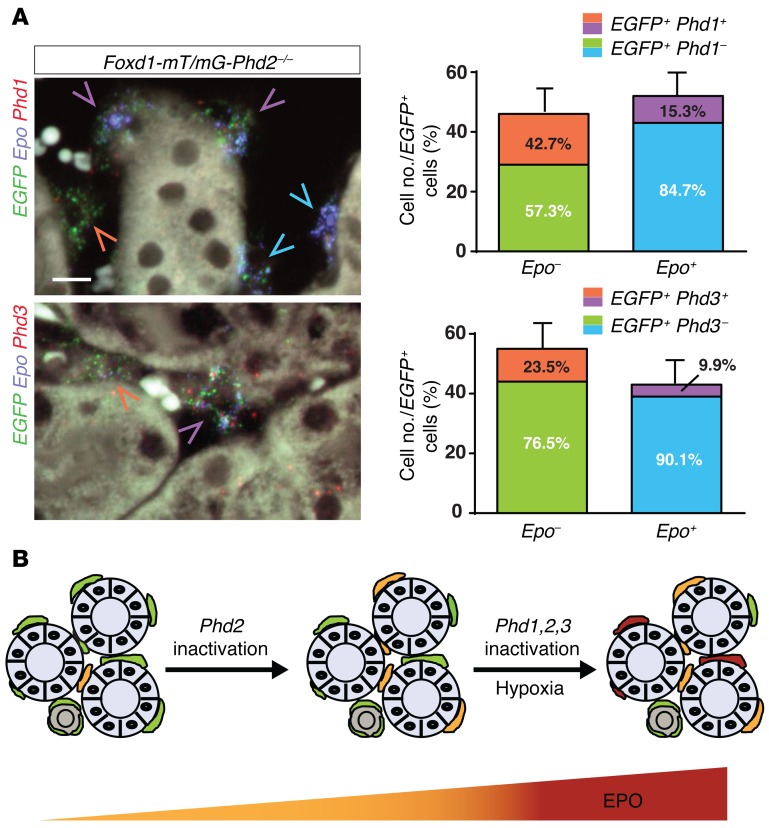
Figure 8. Phd1 and Phd3 are differentially expressed in Phd2–/– renal interstitial cells.
(A) Results from multiplex fluorescent ISH studies using formalin-fixed, paraffin-embedded kidney tissue sections from Foxd1-mT/mG-Phd2–/– mice detecting Epo (blue signal), EGFP (green signal), and Phd1 or Phd3 transcripts (red signal). Shown are representative images; blue arrowheads depict EGFP+Epo+Phd1– cells, purple arrowheads depict EGFP+Epo+Phd1+ or EGFP+Epo+Phd3+ cells, and orange arrowheads point toward EGFP+Epo–Phd1+ or EGFP+Epo–Phd3+ cells. Scale bar: 10 μm. Quantification of cells is shown in the right panels (n = 3 each group). Data are represented as mean ± SEM. (B) Schematic depicting the role of individual PHDs in the regulation of REPC number and renal EPO output. EPO-producing cells are indicated by orange and burgundy red color. Renal interstitial cells that do not produce EPO are indicated by green. Renal tubules are depicted by gray.

