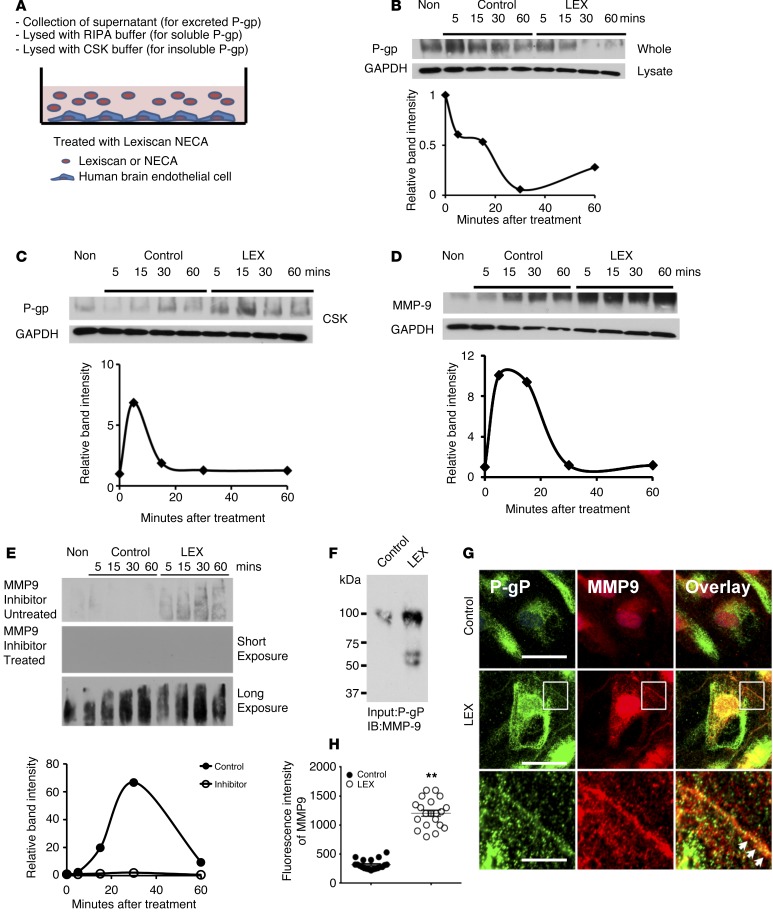
Figure 4. P-gp downmodulation by Lexiscan is mediated by MMP9 cleavage and translocation to insoluble cytoskeletal fractions.
(A) Schematic diagram of experimental procedure for analysis of Lexiscan’s effect on P-gp solubility and excretion in primary brain endothelial cells (HBMVEC). (B and C) Western blot analysis of P-gp expression of HBMVEC upon activation with Lexiscan at different time points after lysis with RIPA buffer (B) or CSK buffer to measure P-gp levels in the cytoskeletal fraction (C). Band intensity was normalized to GAPDH and graphed. (D) Western blot analysis of MMP9 in HBMVEC upon activation with Lexiscan at different time points. Band intensity was normalized using GAPDH and plotted. (E) Western blot analysis of secreted P-gp in HBMVEC upon activation with Lexiscan in absence or presence of an MMP9 inhibitor: both short and long exposures of Western blot from MMP9 inhibitor–treated samples are shown. Band intensity was plotted as graph. (F–H) Immunoprecipitation assay (F) of MMP9 with lysate from HBMVEC treated with vehicle (control) or 1 μM of Lexiscan for 5 minutes. P-gp was pulled down using anti–P-gp antibody and immunoblotted with an anti-MMP9 antibody. IFA (G) of MMP9 on HBMVEC treated with control (top panel) or 1 μM of Lexiscan (middle panel) for 5 minutes. Cells were stained with P-gp (green) and MMP9 (red). Nucleus was counterstained with DAPI (blue). Boxed region (inset) of Lexiscan-treated sample was magnified and displayed separately (bottom panel). Cell-surface colocalization of P-gp and MMP9 is indicated by arrows. Scale bars: 25 μm (upper and middle panels); 5 μm (bottom panels). (H) Analysis of intensity of fluorescence of MMP9 from G. Fluorescent intensity of MMP9 was quantified and plotted as graph (n = 20). **P < 0.01 (2-tailed Student’s t test, 1 representative result of 3 different experiments).

