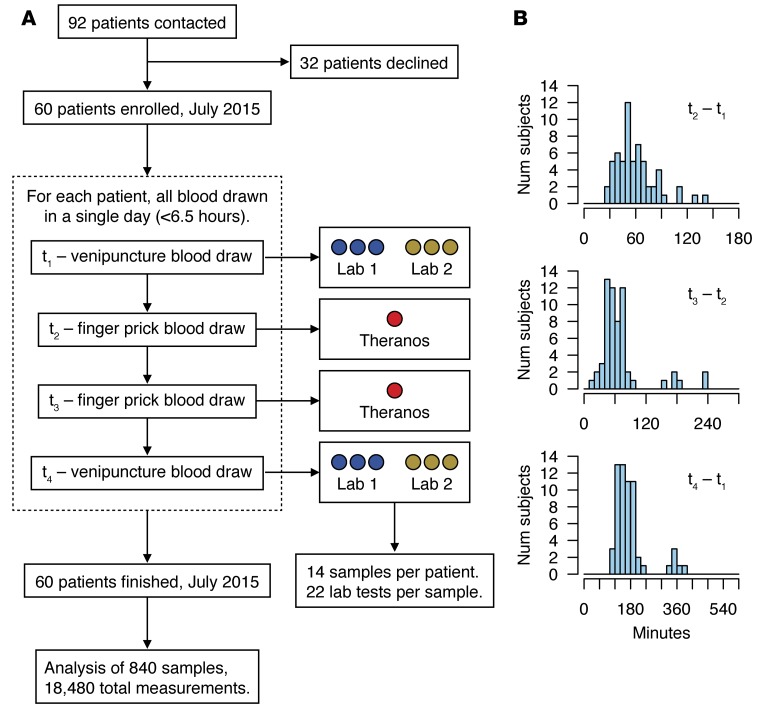
Figure 1. Study design and sample collection.
(A) STARD flow diagram of the cohort study. A total of 60 patients were enrolled and completed the study. For each patient, 4 separate blood draws were collected within a 6.5-hour window in a single day (mean ±SD, 3 ± 1 hour). Collections at t1 and t4 were split into 6 tubes to evaluate technical variability from 2 major clinical testing services (Lab 1, LabCorp; Lab 2, Quest Diagnostics). Theranos samples were collected from 2 separate retail locations at t2 and t3. (B) Panel of histograms showing the time between blood collections for the (top) first set of finger prick and venipuncture draws (t2–t1), (middle) Theranos samples (t3–t2), and (bottom) overall study (t4–t1).

