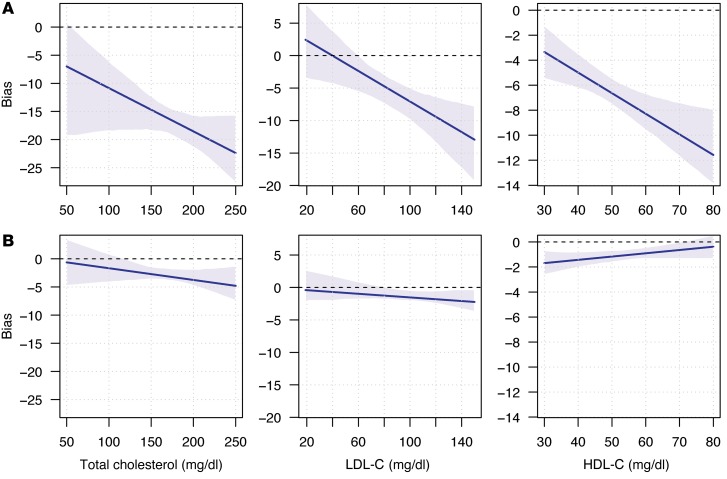
Figure 5. Estimation of laboratory test bias for cholesterol measurements.
Bias estimated calculated using the Passing-Bablok regression (17). Blue line represents the bias across a range of values, and the shaded regions depict the 95% CI. Comparisons show the bias between 2 services. (A) Bias between Theranos low-volume results when LabCorp is the reference. (B) Bias between LabCorp and Quest.

