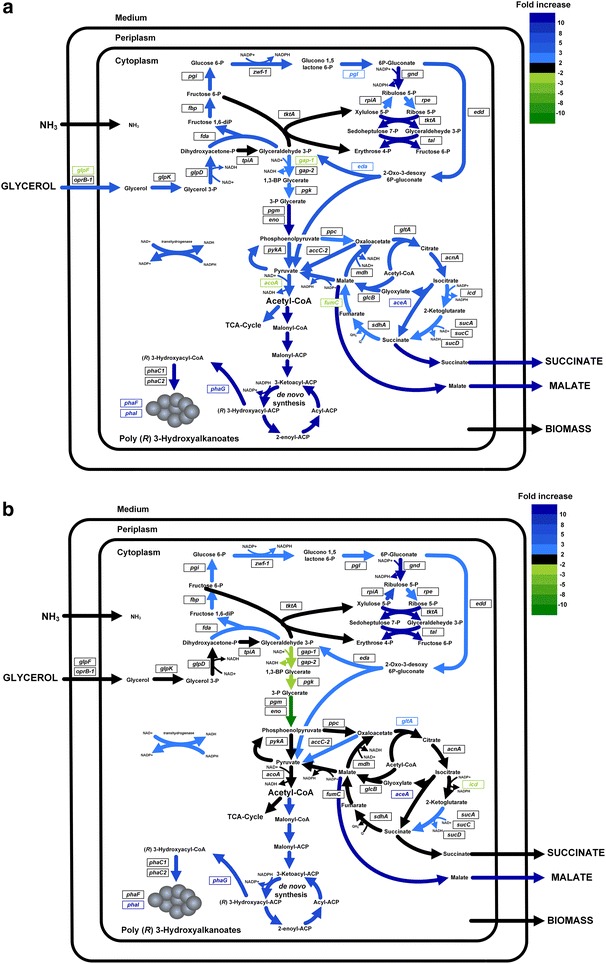
Fig. 5.

Comparison of fluxes and transcription levels between nitrogen and carbon-limitation under a low dilution rate and b high dilution rate. Significant flux differences are indicated by the color of the arrow, whereas differentially expressed genes are color-coded as gene names next to the respective arrows. Green represents transcription levels or fluxes that are significantly higher under carbon-limiting conditions. Contrastingly, blue indicated values that are increased under nitrogen-limiting conditions. Changes that exceeded a twofold increase or decrease were considered significant when the p value did not exceed 0.05
