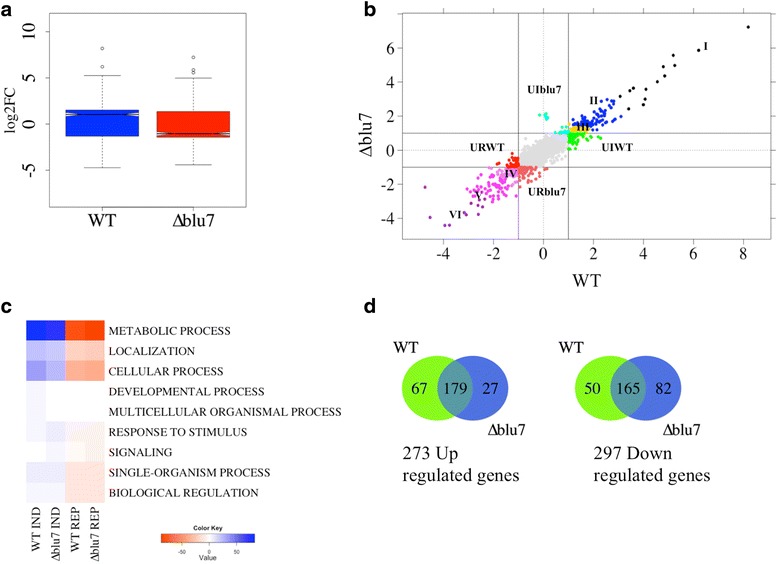
Fig. 2.

Transcriptional response of the WT and ∆blu7 strains 30 min after a pulse of blue light. a Boxplot of log2FC of the total differential light regulated genes in the WT and ∆blu7 strains, compared to dark control of each strain. b Plot of the WT vs ∆blu7 by log2FC, the resulting 6 clusters of the common regulated genes are indicated with roman numbers. The light induced genes present only in the mutant are localized at the positive Y-axis depicted in cyan and the repressed genes in dark orange in the negative Y-axis. The light induced genes present only in the WT are observed in green at the positive X-axis and the repressed genes are in red at the negative X-axis. c BLAST2GO annotation by biological process of the light regulated genes in the WT or ∆blu7 mutant strain. d Venn diagram showing the overlap in up-regulated (left) and down-regulated (right) genes that respond in the WT and ∆blu7 mutant strain
