
Figure 2.
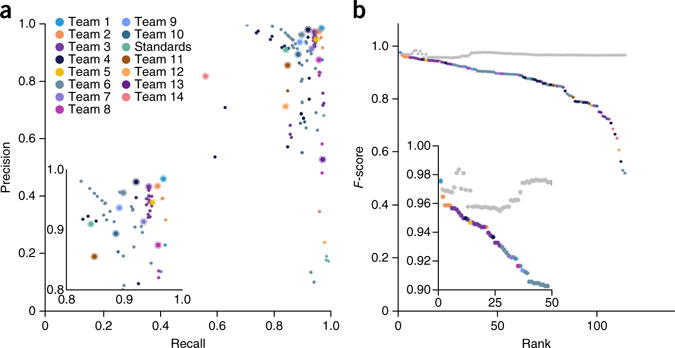
Overview of the SMC-DNA Challenge data set. (a) Precision-recall plot for all IS1 entries. Colors represent individual teams, and the best submission (top F-score) from each team is circled. The inset highlights top-ranking submissions. (b) Performance of an ensemble somatic SNV predictor. The ensemble was generated by taking the majority vote of calls made by a subset of the top-performing IS1 submissions. At each rank k, the gray dot indicates performance of the ensemble algorithms ranking 1 to k, and the colored dot indicates the performance of the algorithm at that rank.