
Figure 5.
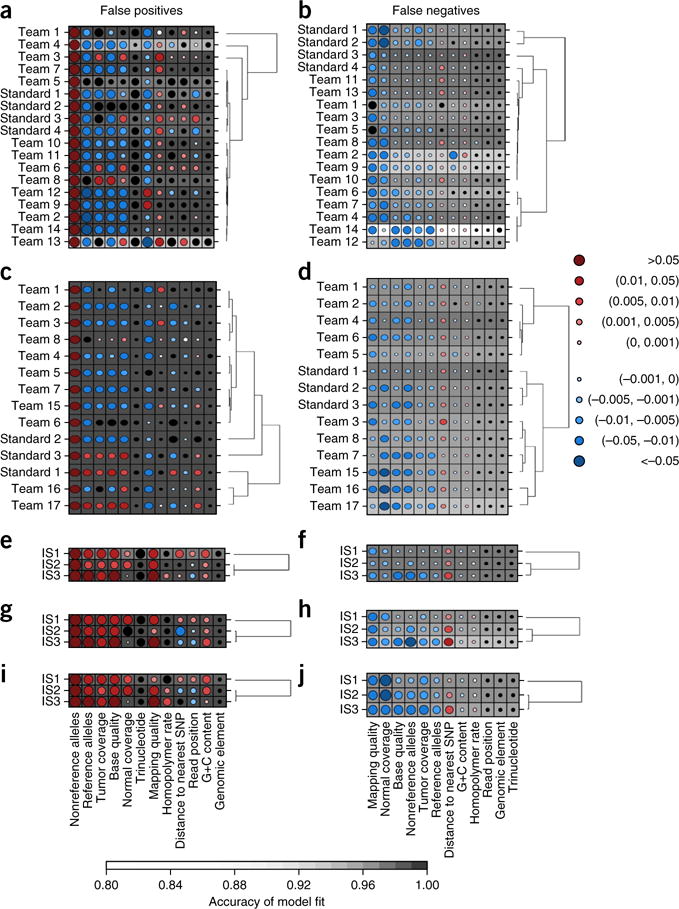
Characteristics of prediction errors. (a–j) Random Forests assess the importance of 12 genomic variables on SNV prediction accuracy (Online Methods). Random Forest analysis of FPs (a,c,e,g,i) and FNs (b,d,f,h,j) for IS1 (a,b) and IS2 (c,d) as well as for all three tumors using default settings with widely used algorithms MuTect (e,f), SomaticSniper (g,h) and Strelka (i,j). Dot size reflects mean change in accuracy caused by removing this variable from the model. Color reflects the directional effect of each variable (red for increasing metric values associated with increased error; blue for decreasing values associated with increased error; black for factors). Background shading indicates the accuracy of the model fit (see bar at bottom for scale). Each row represents a single set of predictions for a given in silico tumor, and each column shows a genomic variable. SNP, single-nucleotide polymorphism.