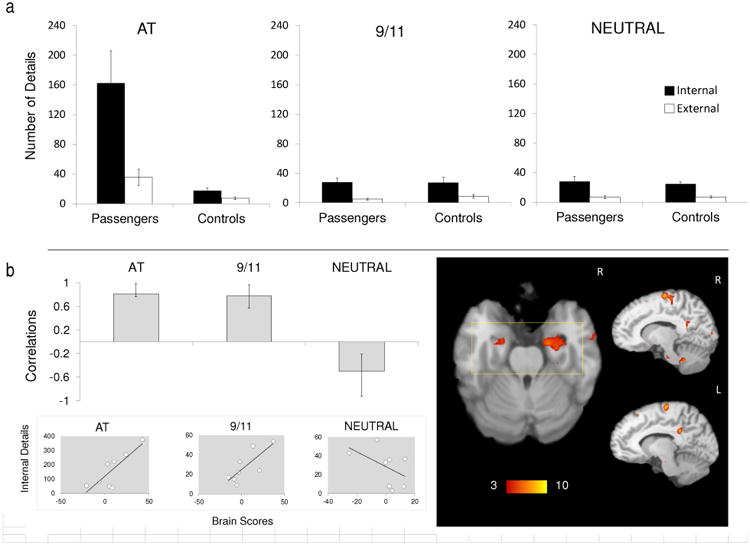
Figure 1.

(a) Mean number of internal (episodic) and external (non-episodic) details recalled for the AT disaster (AT), September 11, 2001 (9/11), and a neutral event (NEUTRAL), for the passengers and comparison participants (controls). Error bars represent standard error of the mean. (b) The graph displays correlations from the significant latent variable (LV) from the partial least squares (PLS) analysis in passengers for all three memory conditions (also see Figure S2). Correlations express how strongly internal (episodic) detail generation was correlated with the pattern of brain regions (i.e., brain scores) that were reliable for the LV (no reliable pattern was observed for external details; see main text). Error bars indicate confidence intervals, with condition differences denoted by non-overlapping error bars. The mean correlation for each condition reliably contributes to the LV if the error bar does not cross zero. The bootstrap ratio map is overlaid on a standard template (Talairach & Tournoux, 1988), which demonstrates clusters with positive bootstrap ratios that were associated with positive mean correlations. A rectangular overlay indicates significant bootstrap ratios in the amygdalae and hippocampi (also see Table 1). Below the PLS graph, scatterplots are displayed to illustrate the individual distribution of brain scores versus internal details. R, right; L, left.
