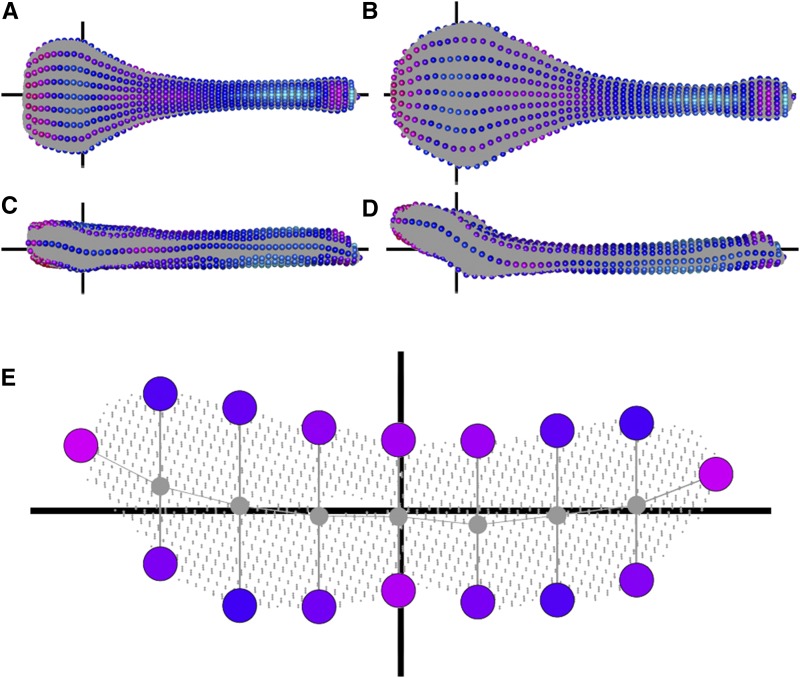
Figure 1.
Visual representation of our morphometric pipeline for defining semilandmarks showing the two “parental extremes.” See text for details. Dorsal (A and B) and lateral (C and D) views of a typical D2 (A and C) or B6 (B, D) individual (specimens #DBA_1 and #C57_1, respectively). The gray background of each bone represents approximately 175,000 x-y-z points segmented from micro-CT scans. Moving from proximal (left sides of A–D) to distal (right sides of A–D), we sampled 50 slices. One slice is shown in more detail (E), which is looking down the center of the bone, displaying an empty internal medullary cavity. Exactly seven points were defined on the ventral and dorsal surfaces, as well as the leftmost and rightmost, totalling 16 semilandmarks per slice, indicated by spheres. The colors of the spheres indicate their contribution to shape differences (LD1) between D2 and B6 with red indicating regions that differ, and blue indicate more similar regions in comparisons between the two parental strains. Horizontal black axes indicate the z-axis (A–D) or the x-axis (E). Vertical black axes indicate the x-axis (A and B), or the y-axis (C–E).

