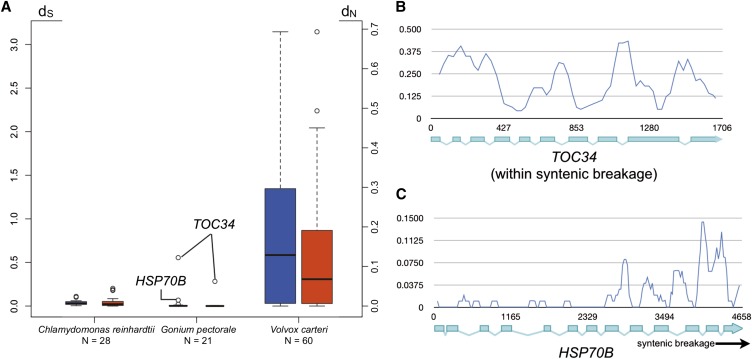
Figure 3.
Molecular evolutionary analyses of volvocine algal gametologs. (A) Box-whisker plots comparing the distributions of dS (blue) and dN (red) values for Chlamydomonas reinhardtii, Gonium pectorale, and Volvox carteri. Open dots in G. pectorale are values for indicated genes. (B) and (C) Sliding window plots of gametolog similarity (Pi) for TOC34 (B) or HSP70B (C). Position within each gene is indicated on x-axis by bp number beginning with the start codon.

