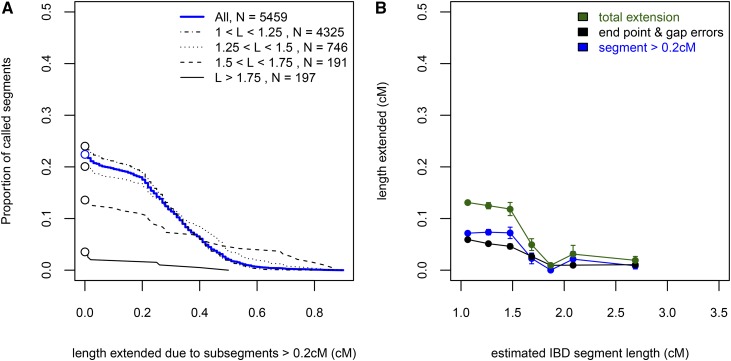
Figure 3.
The conflation effect as a function of the length of IBDcalled segments. (A) The complementary cumulative distribution functions (i.e., 1-CDF) for the total length extended due to subsegments > 0.2 cM (except for the longest IBDARG segment). The distributions are also stratified by four levels of length: Between 1–1.25 cM, between 1.25–1.5 cM, between 1.5–1.75 cM, and > 1.75 cM. The conflation effect is generally driven by segments < 1.75 cM in detected length. (B) The biases in estimated length due to subsegments and end point errors as a function of the estimated length. We binned all IBDcalled segments in 7 bins: [1, 1.2), [1.2, 1.4), [1.4, 1.6), [1.6, 1.8), [1.8, 2), [2, 2.2), [2.2, 20), and for each bin examined the average length extended (from both ends) beyond the longest IBDARG segment found in the called region due to either a subsegment > 0.2 cM (blue), or other minor endpoint errors and gaps between subsegments (black). Each data point is plotted on the x-axis at the median length of the bin. ARG, ancestral recombination graph; CDF, cumulative distribution function; IBD, identity-by-descent.

