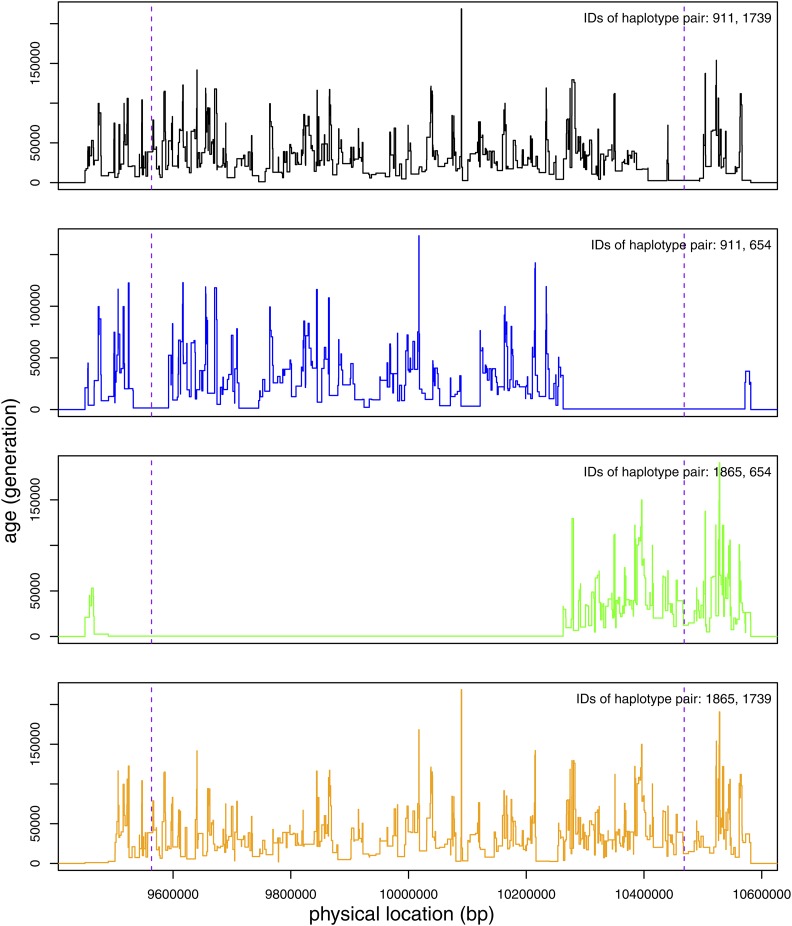
Figure 4.
An illustrative example of the conflation effect on the mutation rate estimator. For a particular IBDcalled segment of length 1.145 cM, we show the distribution of IBDARG subsegment age (y-axis) as a function of position (x-axis, between 9.45–10.59 Mb of a 20 Mb simulated region). Each of the four different pairwise haplotype configurations between the two diploid samples is illustrated with a different color. The simulated haplotype numbers are displayed in the upper right hand corner. The vertical dashed lines demarcate the 10% segment length from both ends of the segment that one could remove from analysis due to the uncertainty in estimating the ends of the IBDcalled segments. The age of each subsegment is plotted as a step function of its length. In this case, the IBD region is dominated by two long segments of IBD, one between simulated haplotypes 1865 and 654, another between simulated haplotypes 911 and 654. (There is actually a third, very short, segment of recent coalescence between simulated haplotypes 911 and 654 that is not obvious here.) Regions that do not produce long IBD segments can be clearly seen with the deep coalescences. In this case, the predominate IBD haplotype should be between haplotypes 1865 and 654, but the conflation with a neighboring IBD haplotype between haplotypes 911 and 654 led to the estimation of a single long IBD segment. ARG, ancestral recombination graph; IBD, identity-by-descent.

