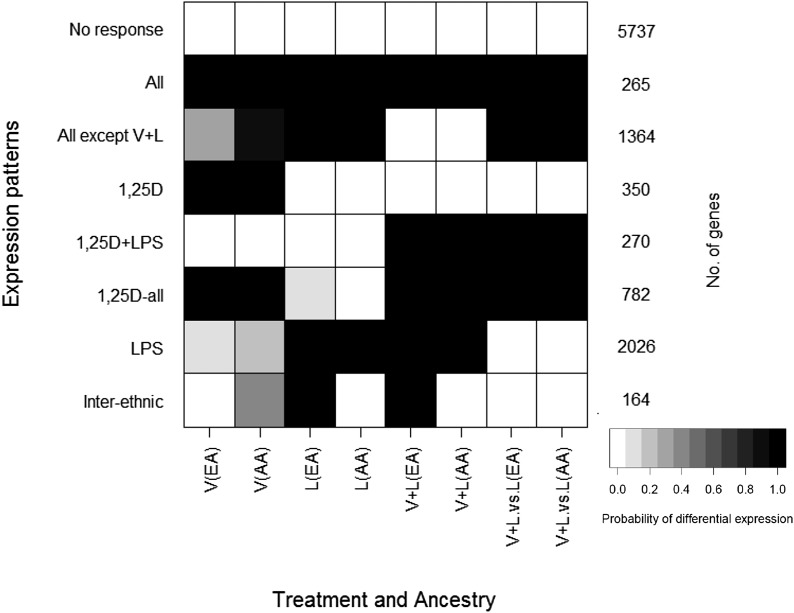
Figure 1.
Transcriptional response patterns shared across the different treatments and ancestries identified by implementing a joint Bayesian analysis using Cormotif. The shading of each box represents the posterior probability that a gene assigned to a given expression pattern (rows) is differentially expressed in individuals from a particular ancestry in response to each treatment (columns). V, response to 1,25D, relative to vehicle; L, response to LPS relative to vehicle; V + L, response to 1,25D + LPS relative to vehicle; V + L.vs.L, response to 1,25D+LPS relative to LPS; EA, European-American; AA, African-American.

