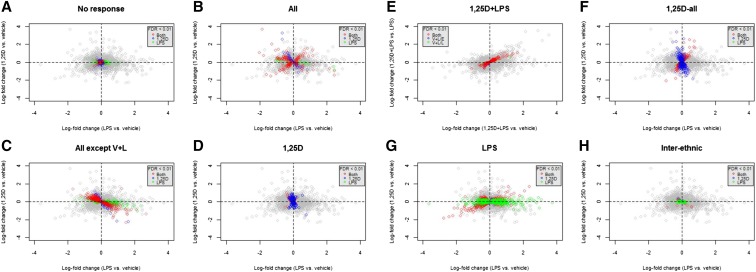
Figure 2.
Direction of response in the different correlation motifs. Patterns of differential response to single treatment with 1,25D (vertical axis) or LPS (horizontal axis) for each correlation motif are shown in (A)–(D) and (F)–(H). (E) Patterns of differential response to the combined treatment with 1,25D and LPS relative to LPS (vertical axis), and 1,25D and LPS relative to vehicle (horizontal axis). Genes are color coded based on q-values < 0.01 from linear mixed-effects analysis as follows: red, DE in response to both 1,25D and LPS; blue, DE in response to 1,25D; green, DE in response to LPS; gray, not DE.

