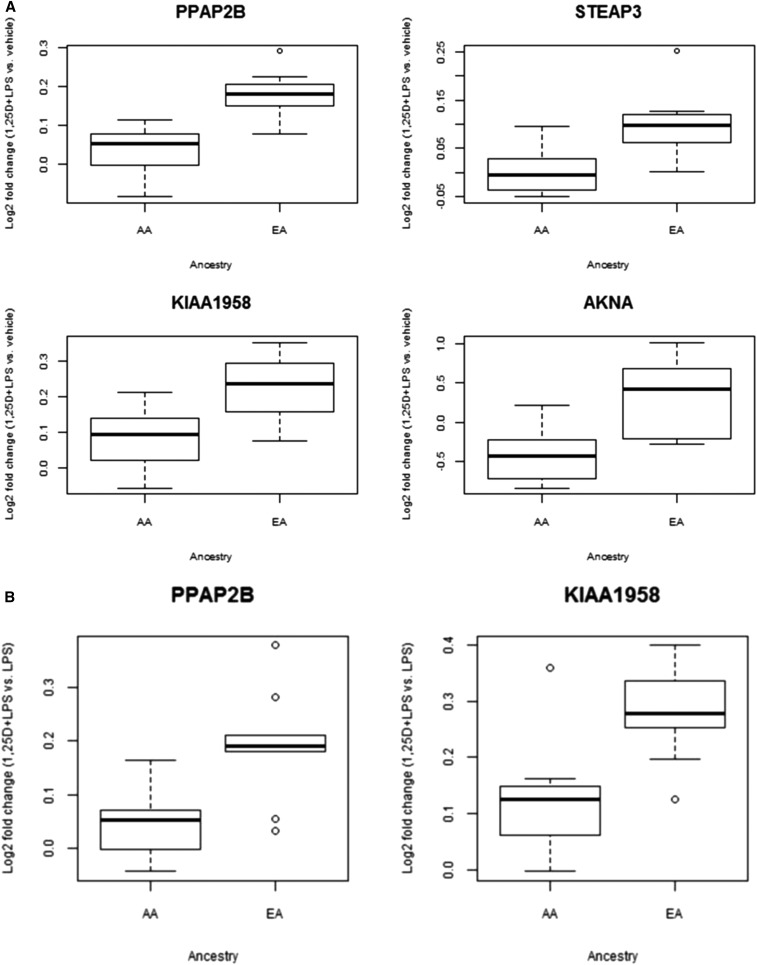
Figure 4.
Interethnic differential response patterns. Genes with interethnic differences in transcriptional responses to 1,25D + LPS relative to vehicle (A), and relative to LPS (B) were identified using the interaction term for treatment and ancestry in the linear mixed-effects model (FDR < 0.10). The boxplots show examples of these genes with different log-fold change in transcript levels between the two ethnic groups. AA, African-American; EA, European-American.

