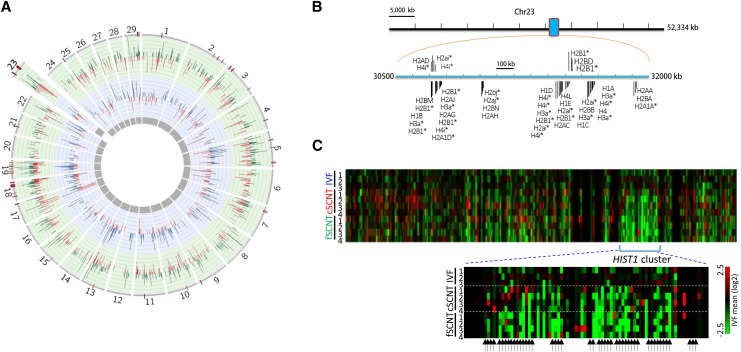
Figure 1.
The HIST1 cluster is downregulated in somatic cell nuclear transfer (SCNT) blastocysts. (A) Circos plot representing significant differentially expressed genes (DEGs; P < 0.05) in cumulus-cell (cSCNT; blue, inner circular layer), and fibroblast SCNT blastocysts (fSCNT; green, outer circular layer), vs. those in in vitro fertilization (IVF) blastocysts. Their fold-change values are shown (blue, green, and red bars within the circular layers). Red bars on the outermost layer represent DEG-rich regions in cSCNT, and/or fSCNT (five or more DEGs per 2 Mb window). Numbers on the outer layer indicate chromosome numbers; X and Y chromosomes are omitted. (B) Distribution of histone genes within the HIST1 cluster, ranging from 30.5 Mb to 32 Mb, on chromosome 23. Predicted histone genes are marked by asterisks. Only histone-related genes are shown, and other genes in the HIST1 locus are omitted. (C) Heat map of genes in the HIST1 cluster showing relative gene expression of single blastocysts to the mean levels of IVF group along the length of chromosome 23. Below, the enlarged HIST1 cluster. Arrows indicate annotated histone genes including predicted ones.

