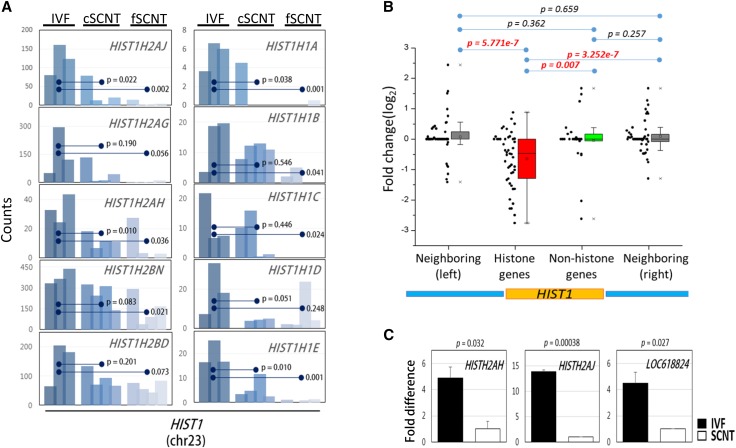
Figure 2.
Downregulation of histone genes at the HIST1 cluster in somatic cell nuclear transfer (SCNT) blastocysts. (A) Expression profiles of HIST1 histone genes in single blastocysts. Bar graphs represent the expression of representative HIST1 histone genes in individual blastocysts between cSCNT or fSCNT groups vs. IVF embryos. Statistical significance between the groups is denoted (Student t-test). (B) Box plot showing relative expression of HIST1 histone genes in both cSCNT and fSCNT groups vs. those in the IVF group. For comparison, 47 histone and 26 nonhistone genes within the HIST1 cluster (yellow box below), as well as the 57 (left) and 47 (right) upstream and downstream genes, respectively (blue boxes), are included. (C) Validation of the HIST1 histone genes in IVF (solid bar) and fSCNT (blank bar) blastocysts by qPCR. Error bars indicate standard deviation of replicated experiments.

