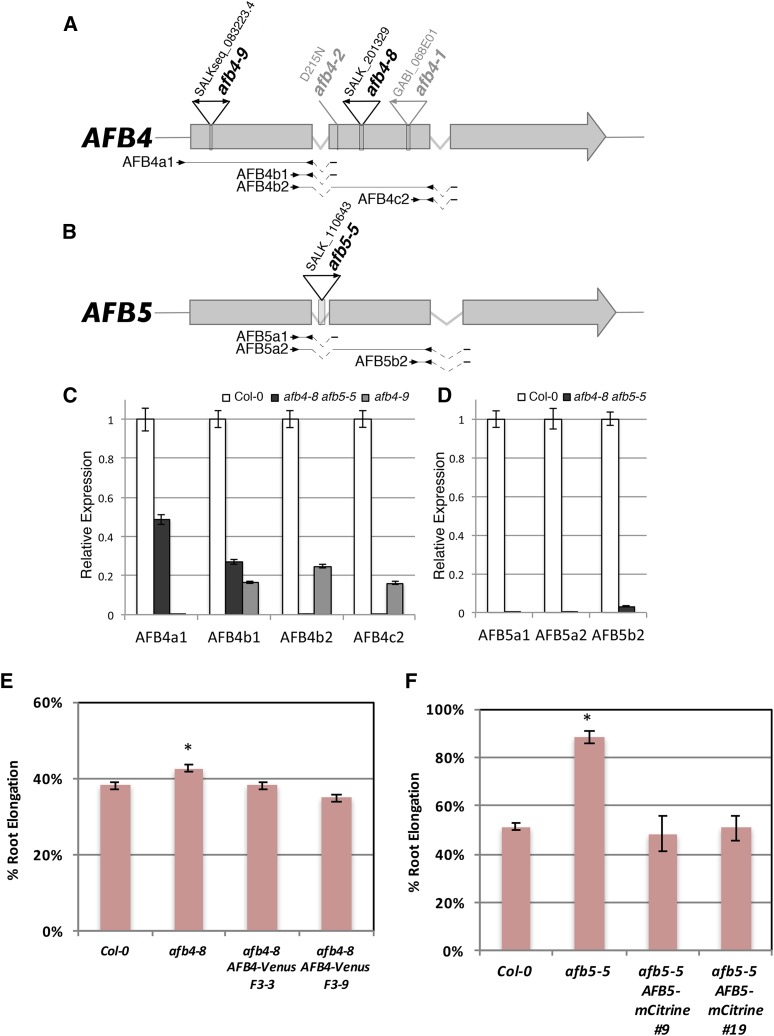
Figure 2.
afb4-8, afb4-9, and afb5-5 mutants do not produce full-length transcripts. (A−B) Diagrams of the AFB4 and AFB5 genes. The positions of mutant lesions are shown above the genes with arrowheads indicating T-DNA left border sequences. Below the gene diagrams are the primers pairs used for qRT-PCR. Kinked dashed lines indicate spliced introns. (C−D) qRT-PCR of AFB4 and AFB5 transcripts in WT and mutants grown under LD conditions. Results from each AFB4 and AFB5 primer pairs were normalized relative to those to the PP2AA3 gene. AFB4a1, AFB4b2, and AFB5a2 were normalized to the longer PP2AA3-L amplicon (448 bp) while the rest used PP2AA3-S (59 bp). Error bars represent standard error. (E) Five-day-old seedlings were transferred to media with or without 8 µM picloram and grown for 4 more days before measuring. F3-3 and F3-9 are two independent F3 populations. n = 54, 56, 48, and 39, respectively. Error bars represent standard error. *P < 0.05 with Col and both transgenic lines. (F) Five-day-old seedlings for Col-0, afb5-5, and two afb5-5 pAFB5:AFB5-mCitrine lines (T2 generation) were transferred to media with or without 10 µM picloram and grown for 4 more days before measuring. The pAFB5:AFB5-mCitrine seedlings were then tested for sensitivity to basta herbicide; measurements from sensitive seedlings were excluded. Results are presented as the percent of the DMSO control treatment for each genotype. n = 12, 12, 5, and 5 for Col-0, afb5-5, line 9, and line 19, respectively. Error bars represent standard error. *P < 0.05 vs. Col-0 and both transgenic lines.

