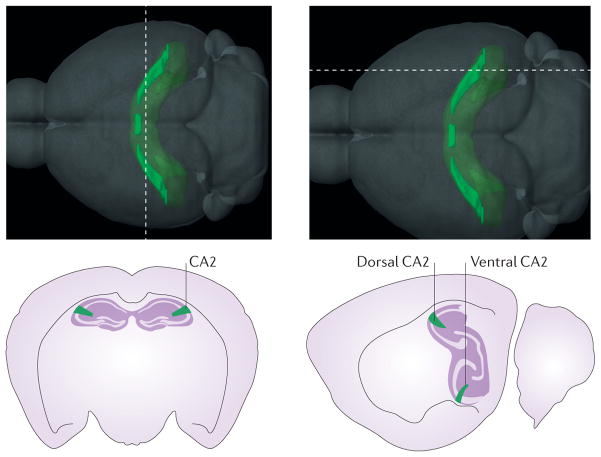
Figure 1. Hippocampal area CA2 in the mouse brain.
The top panel illustrates the location and gross structure of the mouse CA2 region, as defined by the Allen Institute for Brain Science on the basis of the differential expression of almost 50 genes. Thedashed lines indicate the positions of the slices that are represented in the bottom panels. Interestingly, most of these ‘CA2-enriched’ genes are not expressed in the ventral hippocampus of the mouse (lower right panel), even though other atlases have classically included CA2 in most of the ventral third of the hippocampus81. Images in the top panel are reproduced with permission from © 2015 Allen Institute for Brain Science. Allen Mouse Brain Atlas [Internet]. Available from: http://mouse.brain-map.org.

