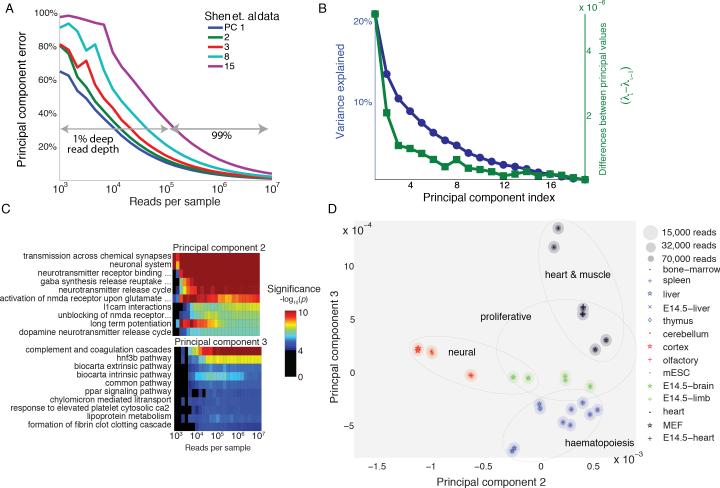
Figure 2. Transcriptional states of mouse tissues are distinguishable at low read coverage.
(A) Principal component error as a function of read depth for selected principal components for the Shen et al. data. For first three principal components, 1% of the traditional read depth is sufficient for achieving >80% accuracy. Improvements in error exhibit diminishing returns as read depth is increased. Less dominant transcription programs (principal components 8 and 15 shown) are more sensitive to sequencing noise.
(B) Variance explained by transcriptional program (blue) and differences between principal values (green) of the Shen et al. data. The leading, dominant transcriptional programs have principal values that are well-separated from later principal values suggesting that these should be more robust to measurement noise.
(C) Gene Set Enrichment significance for the top ten terms of principal component two (top) and three (bottom) as a function of read depth. 32,000 reads are sufficient to recover all top ten terms in the first three principal components. (Analysis for first principal component shown in Figure S1D and S1E.)
(D) Projection of a subset of the Shen et al. tissue data onto principal components two and three. The ellipses represent uncertainty at specific reads depths. Similar tissues lie close together. Transcriptional program two separates neural tissues from non-neural tissues while transcriptional program three distinguishes tissues involved in haematopoiesis from other tissues. This is consistent with the GSEA of these transcriptional programs in (C).

