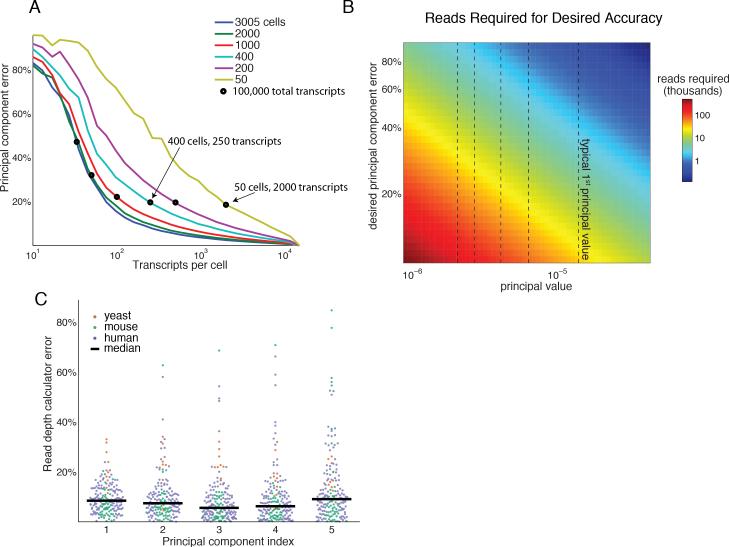
Figure 6. Mathematical framework provides a Read Depth Calculator and guidelines for shallow mRNA-seq experimental design.
(A) Error in the first principal component of the Zeisel et al. dataset for varying cell number and read-depth. Black circles denote a fixed number of total transcripts (100,000). Error can be reduced by either increasing transcript coverage or the number of cells profiled.
(B) Number of reads required (color) to achieve a desired error (y-axis) for a given principal value (x-axis). Typical principal values (dashed black vertical lines) are the medians across the 352 gene expression datasets.
(C) Error of the Read Depth Calculator (Equation 2) across 176 gene expression datasets used for validation (out of 352 total). The calculator predicts the number of reads to achieve 80% PCA accuracy in each dataset (colored dots). The predicted values closely agree with simulated results, with the median error <10% for the first five transcriptional programs.

