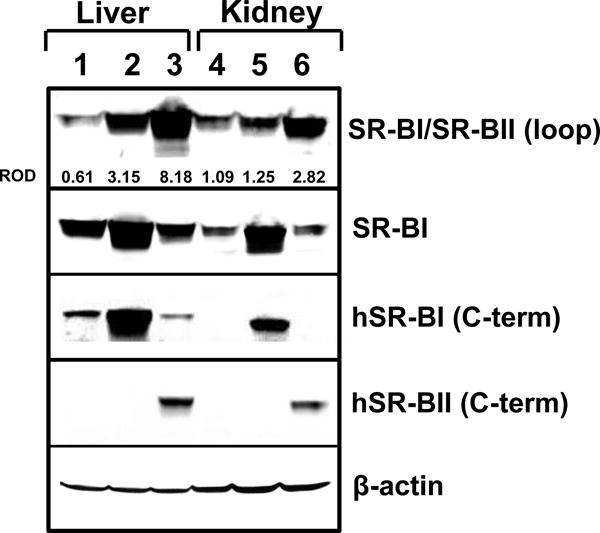
Figure 1. Western blot analyses of liver and kidney tissue samples.

Western blot analyses for hSR-BI and hSR-BII protein expression were performed in liver and kidney tissue samples from WT (lanes 1, 4), hSR-BI tgn (lanes 2, 5) and hSR-BII tgn (lanes 3, 6) mice. hSR-BI and hSR-BII protein expression was detected by using either anti-human SR-BI and anti-human SR-BII custom antibodies (against specific peptides from C-terminal domains) or anti-human SR-BI/BII antibody (against 104–294 amino acid peptide, BD Biosciences). mSR-BI expression was detected by anti-SR-BI antibody (against C-terminal 450–509 amino acid peptide, Novus Biologicals, cat. # NB400-101). Protein expression of β-actin was measured as the loading control. ImageJ software was used to quantify the protein bands intensity, and the relative optical density (ROD) of SR-BI and SR-BII specific bands was calculated versus corresponding β-actin values (upper panel).
