
Figure 4. Kidney gene expression of inflammatory cytokines in WT, hSR-BI and hSR-BII transgenic mice challenged with LPS.
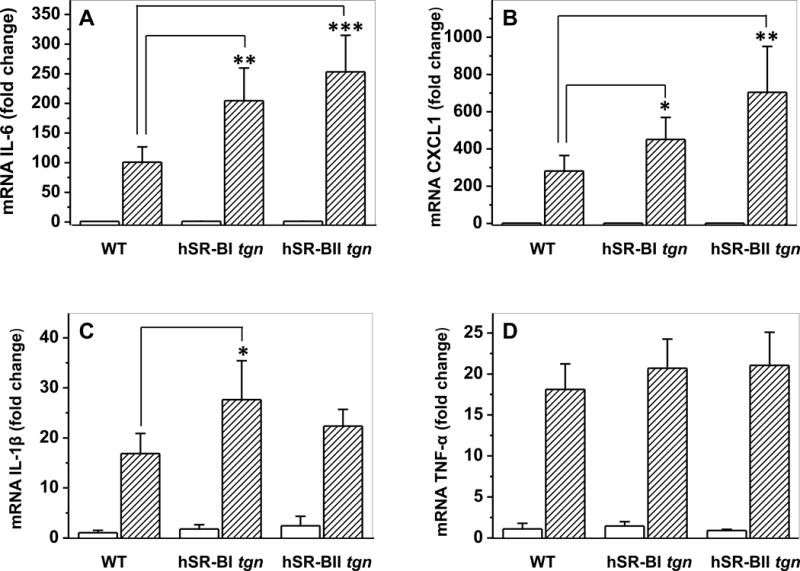
LPS (1 mg/kg, IP) or PBS was injected into WT, hSR-BI and hSR-BII tgn mice. Mice were euthanized after 6 hours; kidney samples were collected and used for mRNA extraction and qRT-PCR as described in Materials and Methods. Expression levels of IL-6 (A), CXCL1 (B), IL-1β (C) and TNF-α (D) were normalized by GAPDH and presented as the fold change relative to PBS-treated control. Values shown are the mean ± SD (n=3, for non-treated groups, n=5 for LPS-treated groups). * P<0.05, ** P<0.01 vs WT LPS-treated mice.