
Figure 8. LPS-induced kidney damage in various mice.
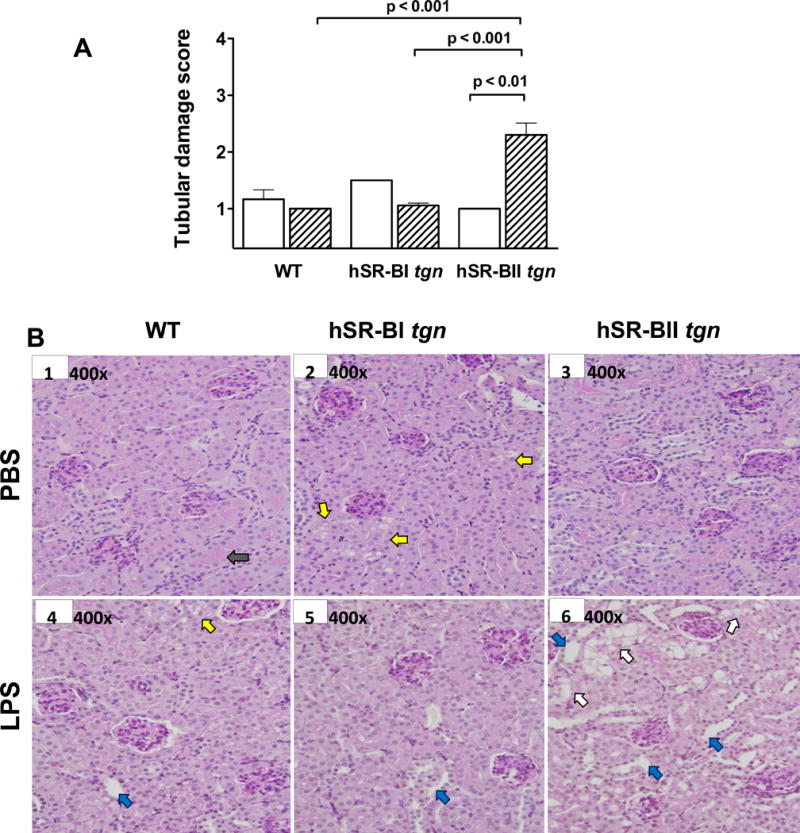
Semi-quantitative analysis of kidney injury. Kidney tubular damage was defined as tubular epithelial swelling, loss of brush border, vacuolar degeneration, necrotic tubules, cast formation, and desquamation, and scored from 1 through 4 according to % area of involvement per HPF (400×). A. Tubular damage scores of mice that received PBS (N=4–5/group, open bars), and mice that received an LPS injection (N=5/group, dashed bars). B. Representative images (400×) of kidney sections stained by PAS from each group (mice that received PBS: WT – image B1, hSR-BI tgn – image B2, and hSR-BII tgn – image B3), mice that received. LPS: WT – image B4, hSR-BI tgn – image B5, and hSR-BII tgn – image B6. The description of the arrows is in the Results section.