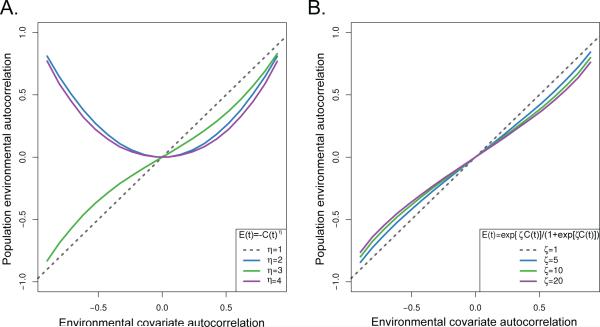
Fig. 2.
The effect of two different nonlinear interactions on an autocorrelated time series, C(t). The dashed black line is the autocorrelation estimated in the untransformed environmental covariate, while the colored lines are the population environmental autocorrelation (PEA) values in E(t) for different transformations. Panel A corresponds to power transforms of the form E(t) = –C(t)η. Panel B corresponds to the logistic function, . All estimations were made using an AR(1) model.

