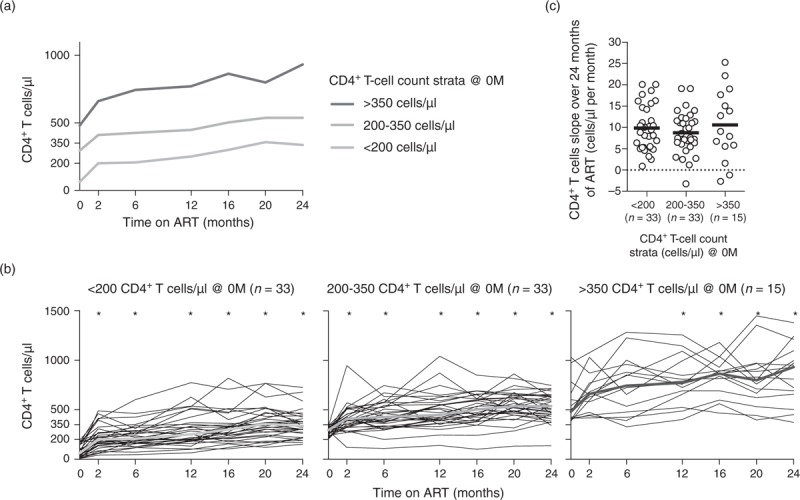
Fig. 1.
CD4+ T-cell counts increase rate was similar between individuals with quite distinct CD4+ T-cell counts at baseline.

(a) CD4+ T-cell progression for three-defined CD4+ T-cell strata. The median of each time point is represented for the three strata independently. (b) The evolution of the CD4+ T-cell counts throughout ART is represented for each individual (thin black lines) and for the median of all the individuals (thick green line). The evolution of CD4+ T-cell counts with ART was evaluated using one-way ANOVA repeated measures followed by Bonferroni's multiple comparison tests using as reference group the ART-naive individuals: <200 F (32, 192) = 17.59, P < 0.0001, η2 = 0.326; 200–350: F (32, 192) = 10.83, P < 0.0001, η2 = 0.275; and >350: F (14, 84) = 17.64, P < 0.0001, η2 = 0.140. (c) Comparison of the rates of CD4+ T-cell recovery during the 24 months of ART between the three-defined strata. Slopes were calculated by the least squares estimation method [25]. Each dot represents a single individual and the solid horizontal line the mean. Comparisons were performed using a Kruskal–Wallis test followed by Dunn's multiple comparison tests; no statistical significant differences were observed (X2KW (2, 78) = 0.528 P = 0.7681, η2KW = 0.264). ART, antiretroviral therapy; M, months.
