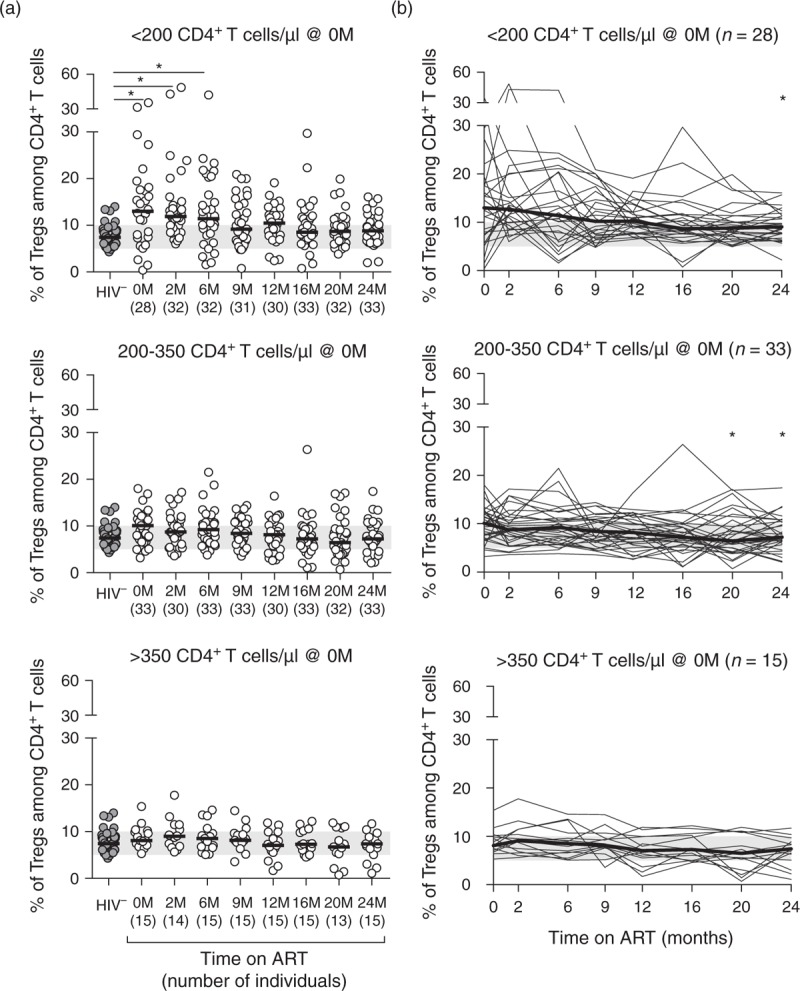
Fig. 2.
Immunosuppressed individuals at ART onset tend to show higher Tregs percentages, which declined with ART for most patients.

(a) Tregs percentages of healthy controls and HIV-infected individuals stratified according to their CD4+ T-cell counts at baseline. Each dot represents a single individual, the horizontal black line represents the group's median, and the shaded green horizontal bar represents the range of Tregs percentages among CD4+ T cells described for healthy individuals using similar markers [8]. Comparisons were performed using an one-way ANOVA or a Kruskal–Wallis test, followed by Bonferroni's or Dunn's multiple comparison tests, respectively, using as reference group the HIV-uninfected individuals: <200: X2KW (8, 286) = 34.590, P < 0.0001, η2KW = 0.118; 200–350: F (8,292) = 1.895, P = 0.0605, η2 = 0.049; and >350: F (8, 152) = 1.759, P = 0.0894, η2 = 0.085. (b) Stratification of HIV-infected individuals according to CD4+ T-cell counts at baseline and longitudinal evaluation of Tregs percentages throughout the first 24 months of ART. Each thin black line represents the Tregs percentages evolution of a single individual and the bold black line represents the median of the individuals for each time point. The evolution of Tregs percentages with ART was evaluated using Friedman's test followed by Dunn's multiple comparison tests using as reference group the ART-naive individuals:<200: X2F (7) = 27.91, P = 0.0002, n = 28, WK = 0.129; 200–350: X2F (7) = 23.19, P = 0.0016, n = 33, WK = 0.091; and >350: X2F (7) = 20.43, P = 0.0047, n = 15, WK = 0.182. ART, antiretroviral therapy; M, months.
