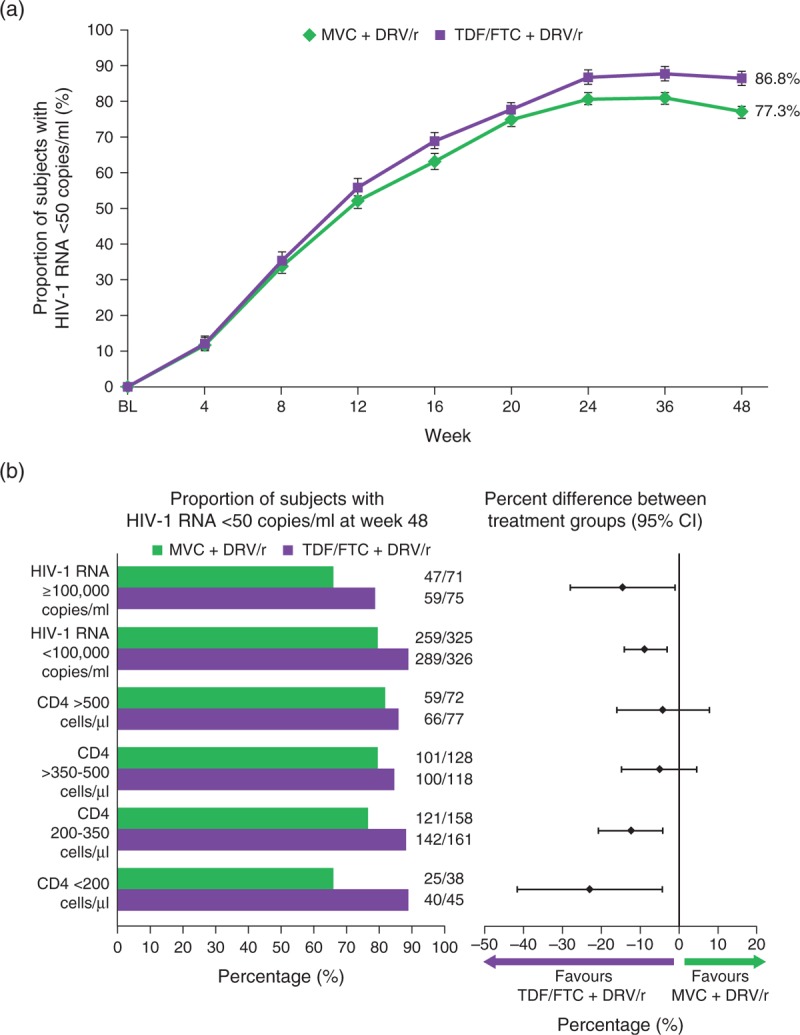
Fig. 2.
. Virologic response at Week 48 by treatment group.

(a) Percentage of individuals with HIV-1 RNA <50 copies/ml with standard errors over time (FAS population) using the FDA snapshot algorithm of MSDF. Plasma HIV-1 RNA concentration was determined using a real-time HIV-1 RNA assay with a lower limit of quantification of 40 copies/ml (Abbott Molecular Inc, Des Plaines, Illinois, USA). (b) Proportion of individuals with HIV-1 RNA <50 copies/ml at Week 48 stratified by baseline HIV-1 RNA (< or ≥100 000 copies/ml) and CD4+ cell count (<200, 200–350, >350–500 and >500 cells/μl), and percentage difference between treatment groups (95% CI) at Week 48 stratified by screening viral load (< or ≥100 000 copies/ml) and baseline CD4+ (<200, 200–350, >350–500 and >500 cells/μl) (FAS population) using the FDA snapshot algorithm of MSDF. CI, confidence interval; DRV/r, darunavir/ritonavir; FAS, full analysis set; FDA, Food and Drug Administration; MVC, maraviroc; MSDF, missing, switch or discontinuation = failure; TDF/FTC, tenofovir/emtricitabine.
