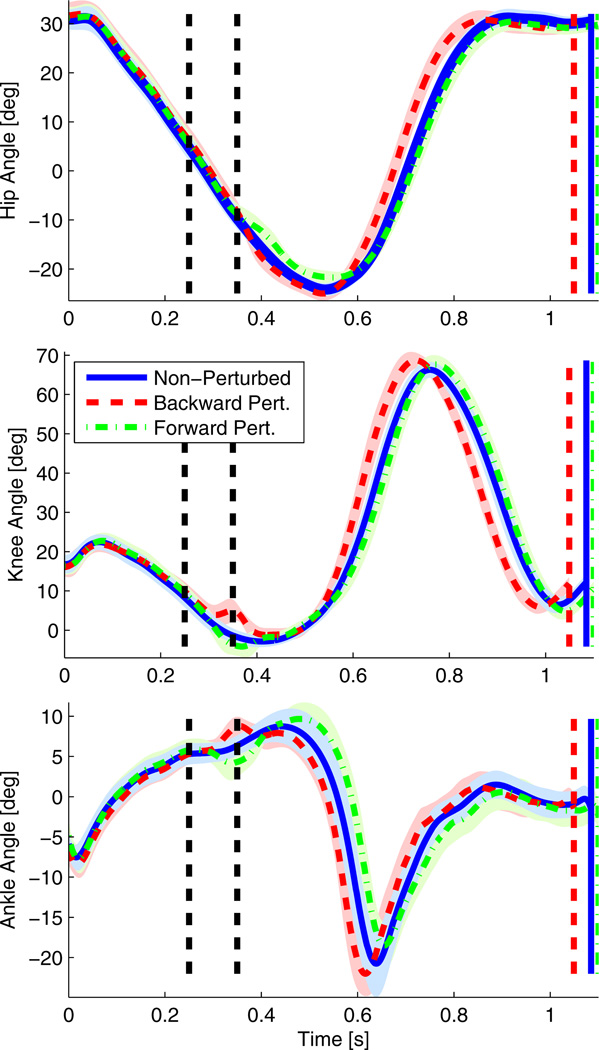
Fig. 8.
Hip, knee, and ankle angles of the initiating leg (i.e., leg stepping on the force plate) over time with and without perturbations 250 ms after IC. Black dashed vertical lines indicate the time span of the perturbation (i.e, 250 ms to 350 ms). Blue solid, red dashed, and green dash-and-dot vertical lines show the time difference between the perturbed and non-perturbed gait cycles. Shaded regions correspond to one SD away from the mean.

