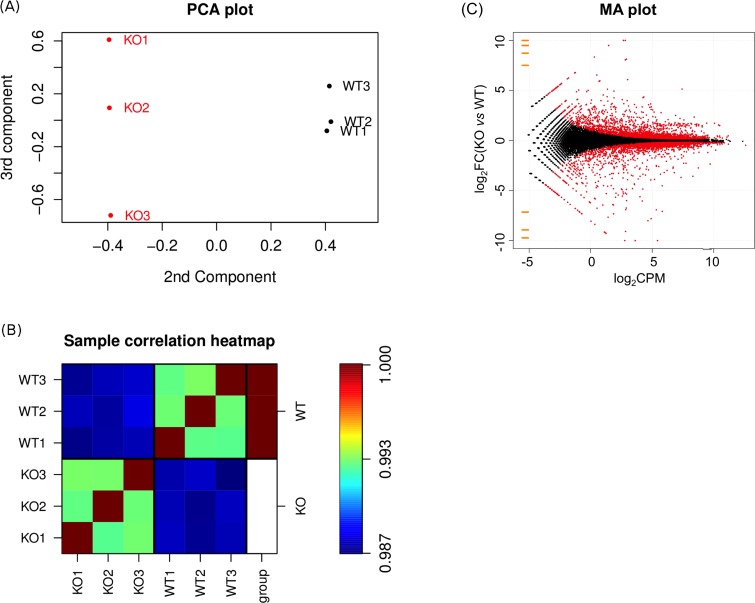
Fig 2. Principal component analysis (PCA), correlation analysis and MA plot of differential gene expression data.
(A) PCA plot of log2 gene expression data showing the 2nd and 3rd principal components. (B) Heatmap visualization of the Pearson correlation coefficients of log2 gene expression between samples. The three samples from wild type KBM-7 cells are labeled WT1-WT3 and those from the KBM-7-NuKO cells KO1-KO3. (C) MA plot showing the distribution of mean gene expression levels (log2Counts Per Million mapped reads) against log2 Fold-Change (KO vs WT) for individual gene responses. Low expression genes (log2CPM < −5) are colored orange. Significant differentially expressed genes (DEGs) are colored red; genes showing no change in expression are colored black.

