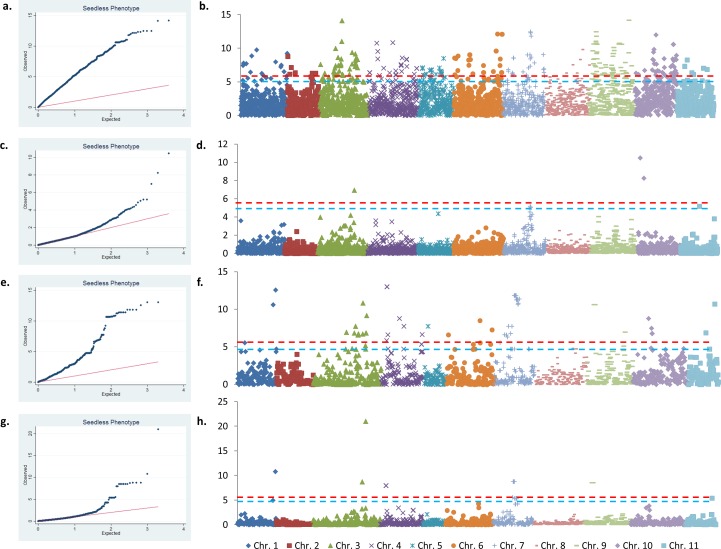
Fig 4. GWAS for the seedless phenotype (MAF > 10%).
Quantile-Quantile plots and corresponding Manhattan plots obtained on the Panel using simple GLM (a-b) and uncompressed MLM K + Q (k = 4) (c-d) and the Papuan Subset using simple GLM (e-h) and uncompressed MLM K (g-h). Colored dashed lines correspond to Bonferroni corrected thresholds of p = 0.05 (blue) and p = 0.01 (red).

