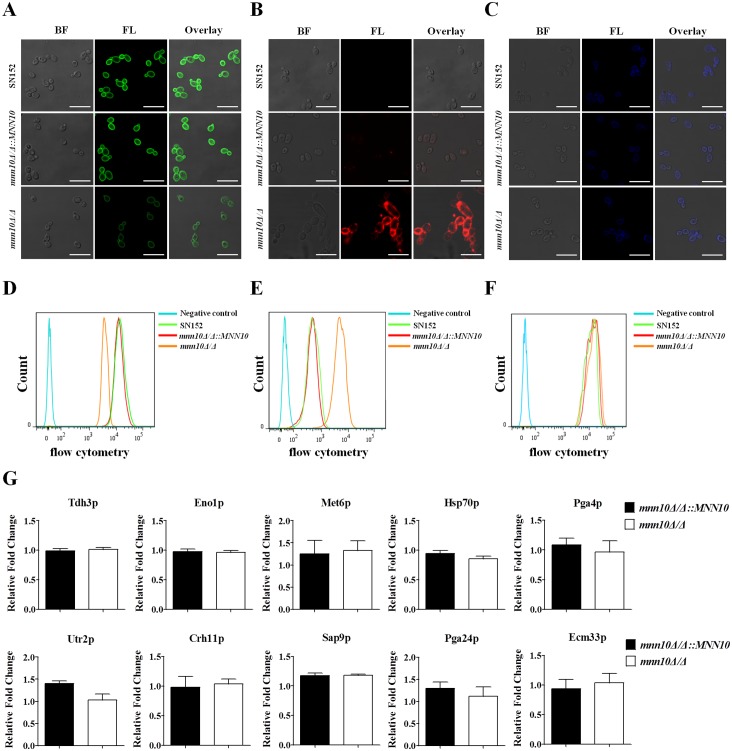
Fig 2. Mnn10 is required for cell wall polysaccharides organization, but not virulence factors attachment.
Representative fluorescence micrographs of three cell wall carbohydrate layers from SN152, mnn10Δ/Δ::MNN10 and mnn10Δ/Δ, which were stained with ConA-FITC to visualise mannan (A), β-glucan antibody to visualize β-(1,3)-glucan (B) and calcofluor white to visualise chitin (C). Bright field (BF), fluorescence (FL), and overlay are shown individually. Scale bar represents 10 μm. The fluorescence intensity was quantified by flow cytometry [mannan (D), β-(1,3)-glucan (E), chitin (F)]. Data are representative of three independent experiments. (G) Relative fold change of representative virulence related cell wall proteins (CWPs) in mnn10 mutant compared to mnn10Δ/Δ::MNN10. The cell wall proteins of SN152, mnn10Δ/Δ::MNN10, and mnn10Δ/Δ strains were analyzed by LC-MS/MS on high-resolution instruments, respectively. Raw files were processed by Max Quant for peptide/protein identification and quantification. The relative data were changed to the ratio of mnn10Δ/Δ::MNN10 and mnn10Δ/Δ to SN152. Data are represented as means ± SEM of three independent experiments. P > 0.05 (Student’s t-test).

