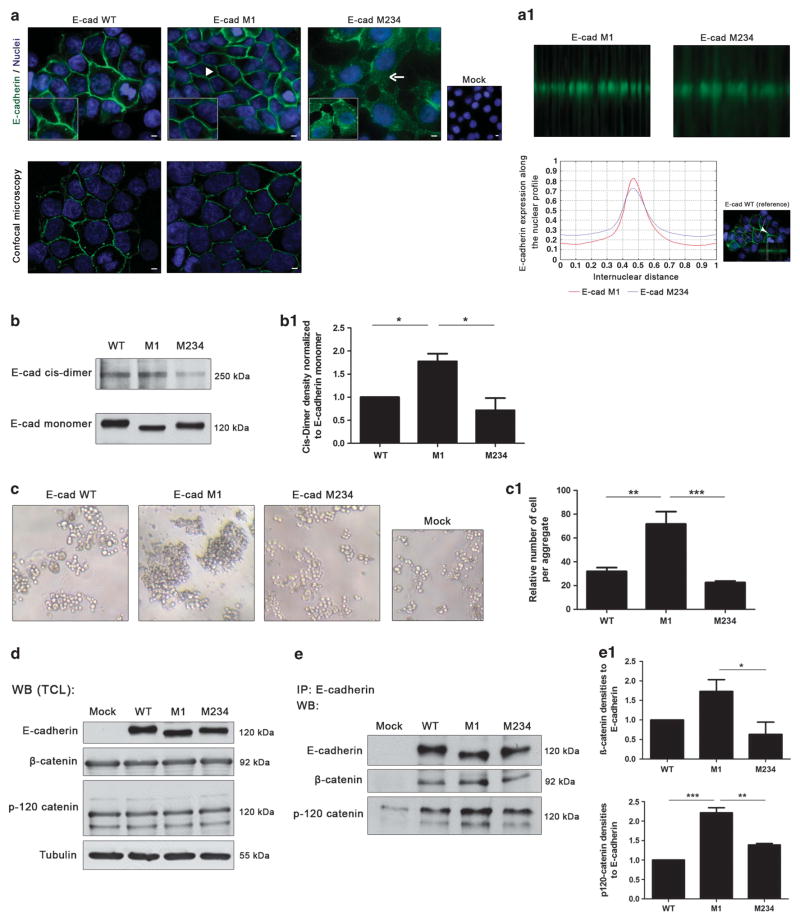
Figure 4.
N-glycosylation at Asn-554 affects E-cadherin biological functions. (a) Immunofluorescence analysis showing that AGS cells expressing E-cadherin WT displayed an epithelial morphology and a membrane localization of E-cadherin (arrowhead). E-cadherin M1 showed a correct localization of E-cadherin at the cell membrane (arrowhead) with a more focused membrane staining than the WT (confocal microscopy). N-glycan mutant with Asn-554 (site 1) occupied with N-glycan structures (M234) is characterized by an incomplete localization of E-cadherin at the cell–cell contacts together with some cytoplasmic staining (arrow). White size bars ~ 5 μm. (a1) Evaluation of the internuclear profiles of E-cadherin M1 and E-cadherin M234. Mutation at site 1 (E-cadherin M1) induces an increased membrane localization of E-cadherin compared with M234, which shows a decreased E-cadherin membrane expression. (b) Evaluation of cis-dimer-formation capacity of E-cadherin using BS3. Mutation of Asn-554 (M1) leads to a significant increase of cis-dimerization of E-cadherin. (b1) Bar graphs. Amounts of E-cadherin cis-dimer were determined from the ratio of densities of E-cadherin cis-dimer/E-cadherin monomer. Results are described as mean ± s. d. of three independent experiments. The E-cadherin cis-dimer formation in E-cadherin M1 and M234 are expressed as the fold increase, compared with the E-cadherin WT, which was taken as 1 (Student’s t-test: *P ≤ 0.05; **P ≤ 0.01; ***P ≤ 0.001). (c) In vitro cell–cell aggregation assay. Mutation at Asn-554 (M1) resulted in a significant increase of cell–cell aggregation than E-cadherin WT and M234 showing larger cell aggregates. (c1) Bar graphs. Quantification of cell–cell aggregation by measuring the relative number of cells per aggregate (three or more cells). Results are described as the mean ± s.d. of three independent experiments. Student’s t-test: *P ≤ 0.05; **P ≤ 0.01; ***P ≤ 0.001). (d) Evaluation of the β- and p120-catenin total protein expression levels in the total protein lysates from AGS Mock, AGS E-cadherin WT and E-cadherin N-glycan mutants M1 and M234 cells. No significant differences were observed among the E-cadherin WT and E-cadherin N-glycan mutants. (e) E-cadherin immunoprecipitation followed by β- and p120-catenin Western-blot. The results showed that mutation of site 1 (Asn-554), M1, is associated with an increased interaction between E-cadherin and the β- and p120-catenin. A decreased interaction between E-cadherin and β-catenin (of about 1.0-fold) in M234 mutant compared with E-cadherin M1 was also verified. (e1) Bar graphs. Amounts of association were determined from the ratios of densities of β- or p120-catenin after normalization to E-cadherin. Results are described as mean ± s.d. of three independent experiments. The E-cadherin/catenin interaction levels in E-cadherin M1 and M234 are expressed as the fold increase, compared with E-cadherin WT, which was considered as 1 (Student’s t-test: *P ≤ 0.05; **P ≤ 0.01; ***P ≤ 0.001). See also Supplementary Figure S4.

