Fig. 1.
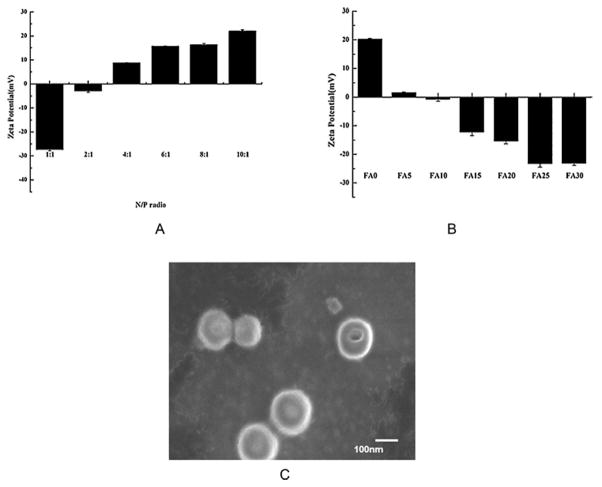
Zeta potential and agarose gel analysis of complexes. (A) Zeta potential of PEI-OA/LOR-2501 complexes at varying N/P ratios. (B) Zeta potential of FA/PEI-OA/LOR-2501 complexes at different FA concentrations. Error bars represent standard deviations (n = 3) (FA0:FA carboxylate/PEI nitrogen/LOR-2501 phosphate = 0:6:1, FA5–FA30:FA carboxylate/PEI nitrogen/LOR-2501 phosphate = 5:6:1–30:6:1). (C) The SEM image of FA15/PEI-OA/LOR-2501 complexes.

