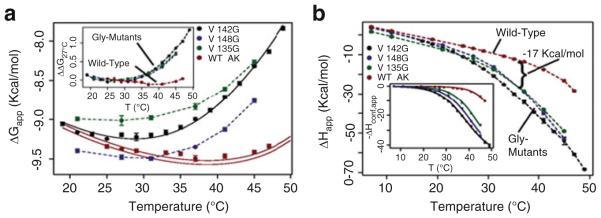
Fig. 9.
Surface mutations affect the thermodynamics of binding. (a) Apparent free energy (ΔGapp) of binding substrate analog Ap5A. Solid black line shows the fitted curve for V142G data. Solid red lines represent the prediction of wild-type data based on the fitting of ΔHconf,app. Error bars show the average standard error of the prediction. The inset displays the change in ΔGapp for each protein referenced with respect to 27°C: ΔΔG27°C(T) = ΔG(T) – ΔG(27°C), clearly demonstrating the similar effects of each mutant on binding. (b) Apparent enthalpy of binding (ΔHapp) Ap5A; similar changes are evident for all mutants. The inset shows corrected data and fits for ΔHconf,app (6)

