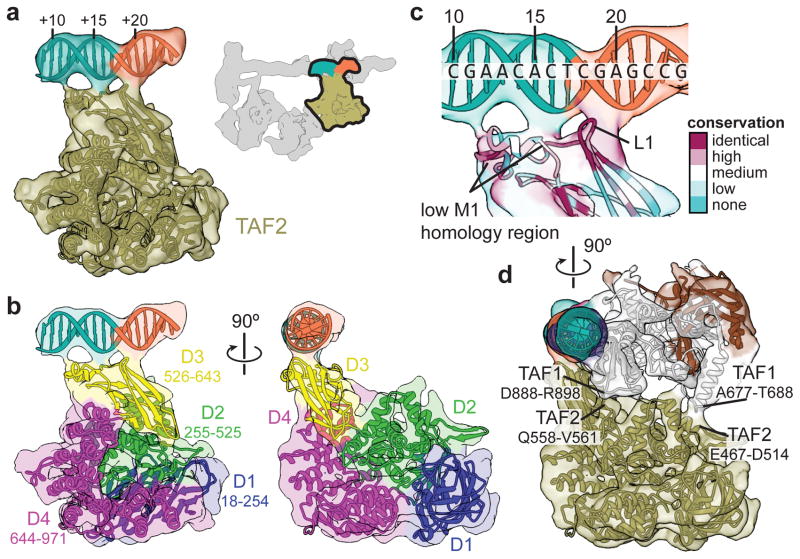
Figure 3. TAF2 APD.
a, Homology-based atomic model of the TAF2 APD fitted into the cryo-EM density. Coloring of the promoter DNA is the same as in Fig. 1. The location of the segmented density in the overall map is highlighted in the upper-right. b, Model of the TAF2 APD colored by domain (D1-4), with boundary residues for each domain indicated. c, Close-up of TAF2 APD domain 3 binding to promoter DNA with residues colored according to conservation (see Extended Data Fig. 5e). d, Side view highlighting the TAF1-TAF2 interface, with potential regions of interaction between the two subunits indicated.

